Direct Mutual Fund SIP Calculator: Estimate Returns Easily
Shlok Sobti

Direct Mutual Fund SIP Calculator: Estimate Returns Easily
Every month, lakhs of Indian investors put money into SIPs without knowing exactly how much they're leaving on the table by choosing regular plans over direct ones. A direct mutual fund SIP calculator helps you put real numbers to that difference, showing you the future value of your investments when you cut out distributor commissions entirely.
Here's why this matters: direct mutual funds have lower expense ratios than regular plans, sometimes by 0.5%–1% or more. Over 10, 15, or 20 years of compounding, that gap translates into lakhs of rupees. But most investors never quantify it. They either guess or ignore it altogether. A dedicated calculator built for direct plans removes the guesswork and gives you a clear projection of where your SIP can realistically land, factoring in the cost advantage that direct funds offer.
At Invsify, we're a SEBI Registered Investment Advisor built around conflict-free, transparent financial advice, which means we recommend only direct mutual funds with zero hidden commissions. Our AI-powered advisory platform helps investors not just calculate potential returns, but act on them with personalized recommendations and real-time portfolio tracking.
This article breaks down how a direct mutual fund SIP calculator works, what inputs drive the results, how to interpret the numbers, and how direct plans consistently outperform their regular counterparts over time. Whether you're starting your first SIP or optimizing an existing portfolio, you'll walk away with the clarity to make sharper investment decisions.
Why use a direct mutual fund SIP calculator
Most investors know SIPs are a good habit. But knowing your SIP is running isn't the same as knowing whether it's working at its full potential. A direct mutual fund SIP calculator gives you a specific projection based on your actual monthly investment, the expected return rate, and your investment horizon. Without this tool, you're essentially flying blind, making long-term financial commitments with no concrete picture of where you'll end up.
See the Real Cost of Choosing Regular Plans
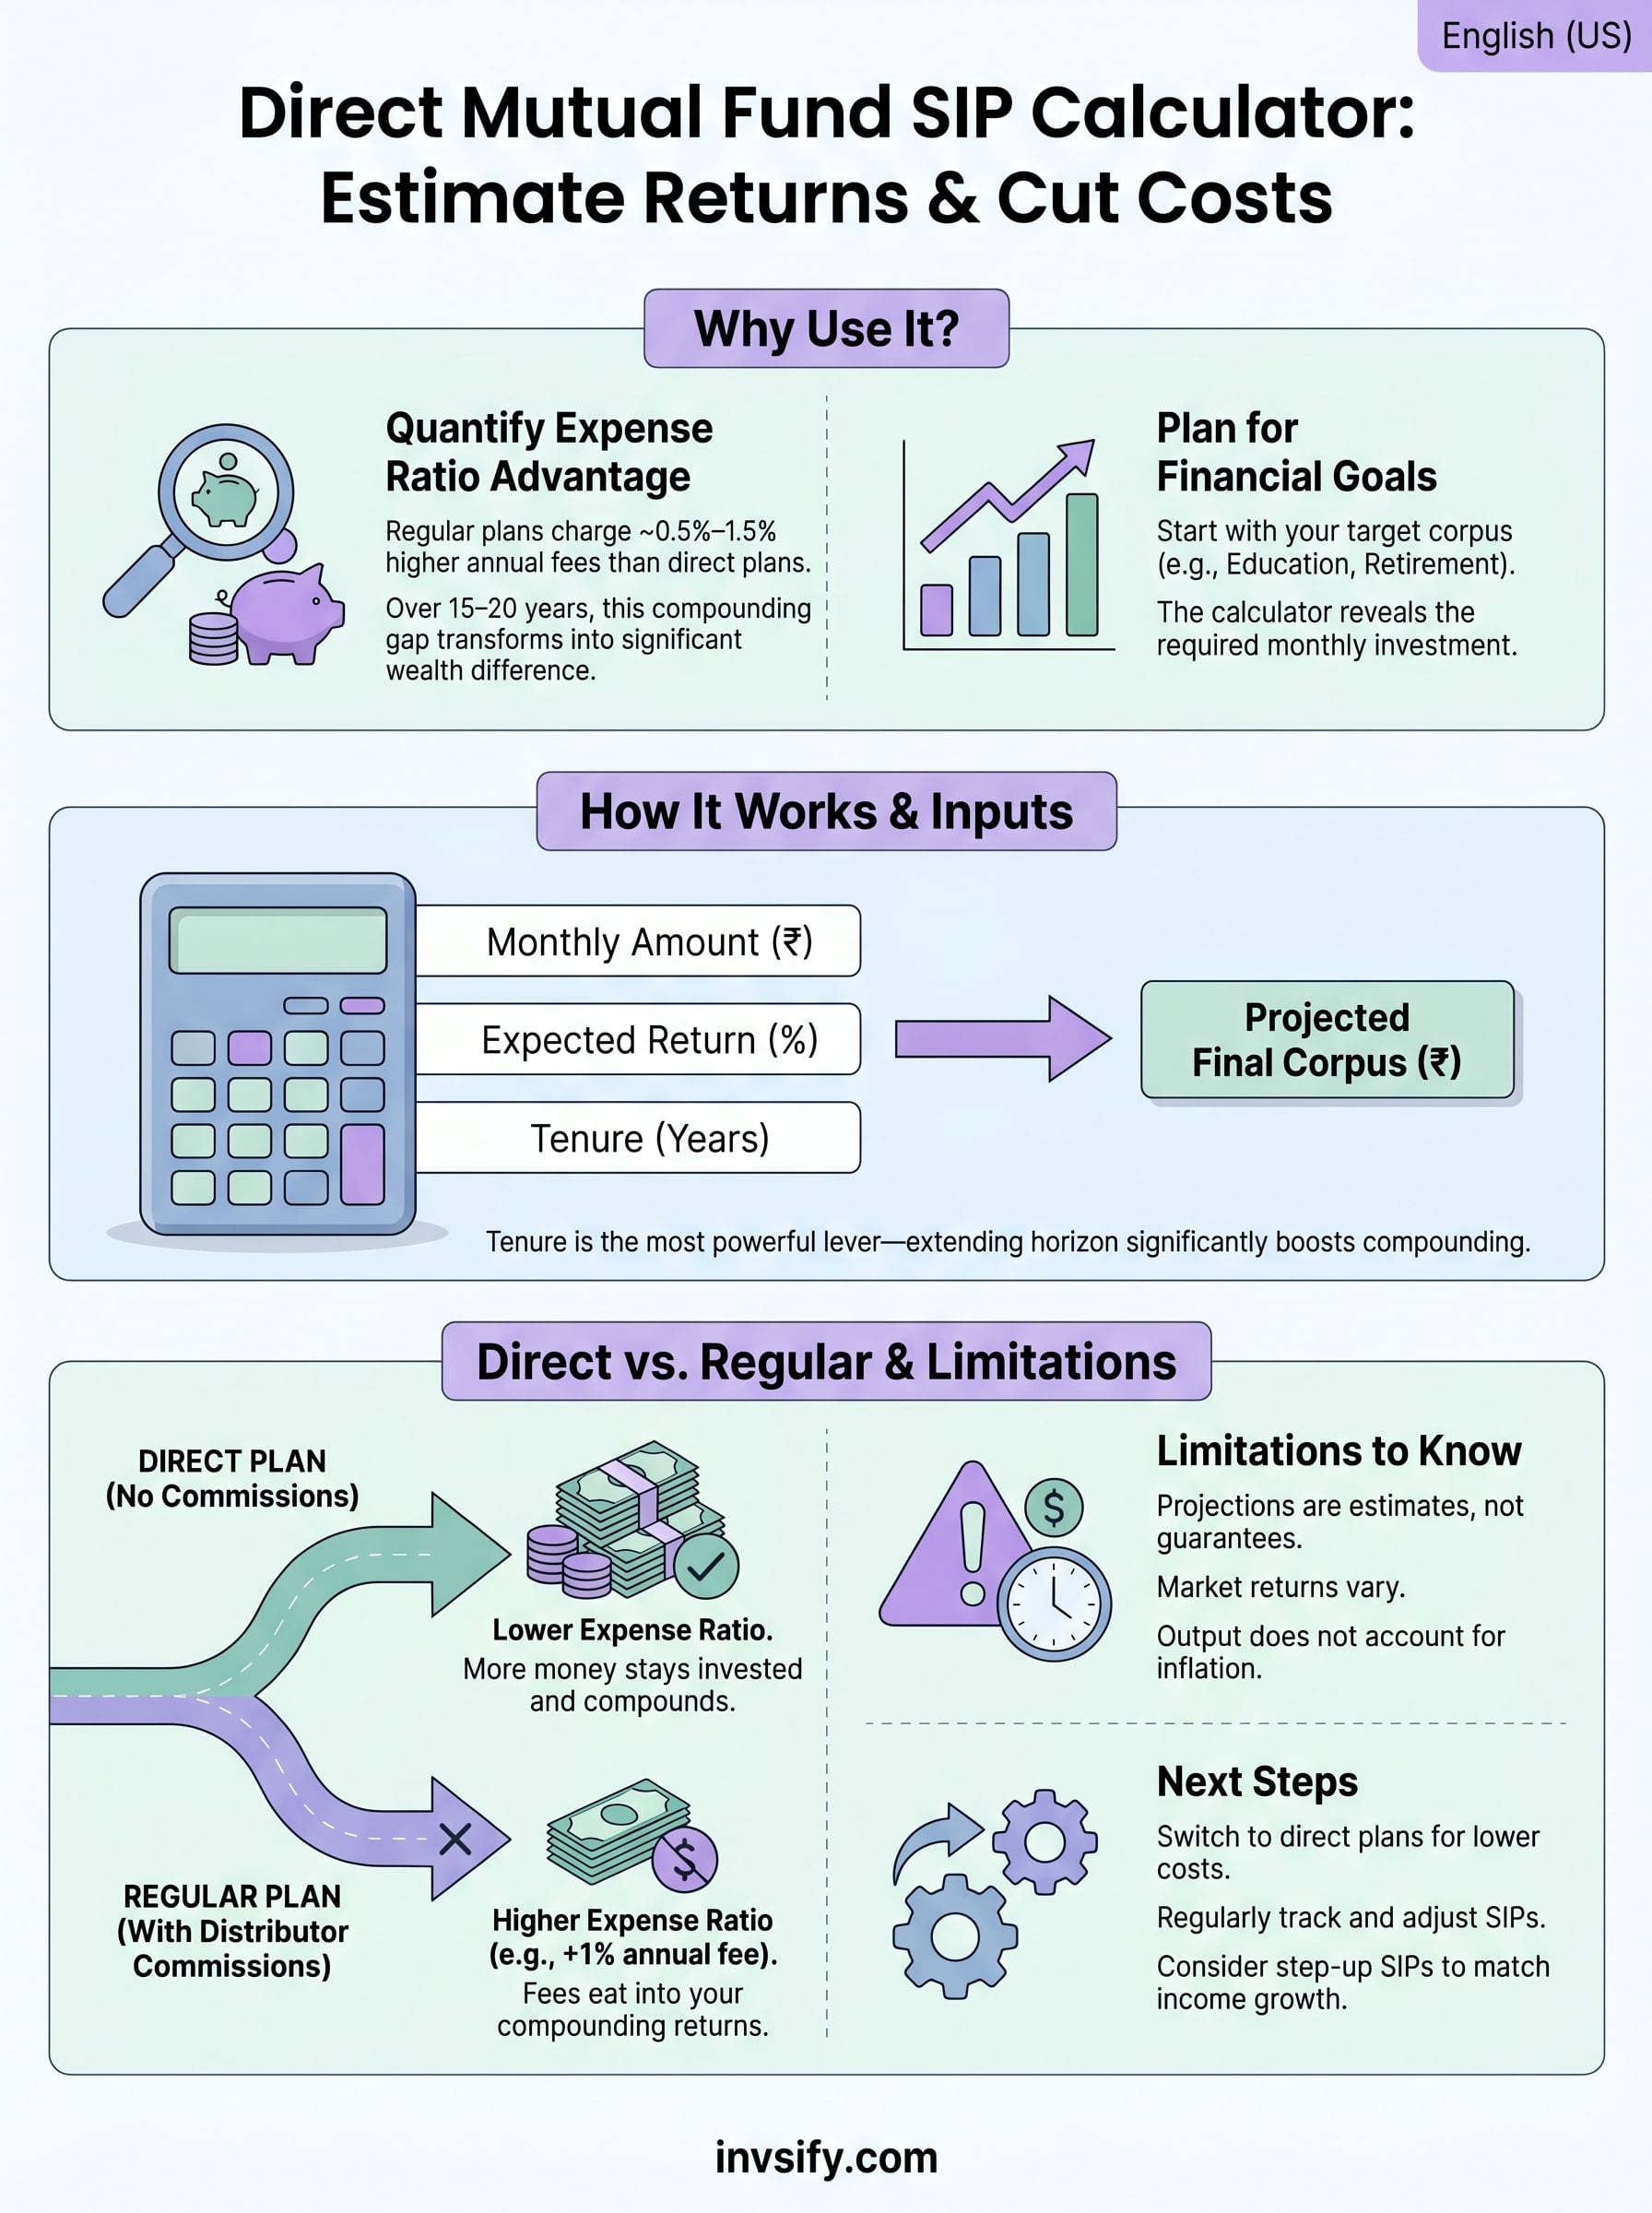
The single biggest reason to use a calculator built specifically for direct plans is to quantify the expense ratio advantage. Regular mutual fund plans include a distributor commission baked into their annual expense ratio, which can be anywhere from 0.5% to 1.5% higher than the equivalent direct plan. That might sound like a small number, but when you apply it to a 15 or 20-year SIP, the compounding effect transforms that gap into a significant wealth difference.
Over a 20-year SIP horizon, even a 1% difference in annual returns can result in a final corpus that is 20–30% larger, depending on the investment amount and compounding frequency.
For example, if you invest ₹10,000 per month at 12% annual returns versus 11% (because you're in a regular plan), the difference over 20 years runs into lakhs. The calculator puts that exact rupee figure on screen within seconds, making the cost of staying in a regular plan impossible to ignore or rationalize away.
Plan Backward From Your Financial Goals
Most people approach SIPs by deciding how much they can afford to invest each month, then hoping it's enough. A goal-based approach works the opposite way: you start with the target corpus you need, whether that's ₹50 lakhs for your child's education or ₹1 crore for retirement, and the calculator tells you exactly how much to invest monthly to reach it.
Running multiple scenarios takes seconds. You can adjust the time horizon, tweak the expected return rate, or change the monthly amount until you find a combination that fits both your goal and your current budget. It turns a vague aspiration into a concrete, time-bound plan with a specific monthly action attached to it.
Track Whether Your Current SIP Is on Course
If you already have a SIP running, the calculator is not just a planning tool; it's a diagnostic one. You can enter your current monthly investment and remaining tenure to project your expected final corpus and compare that number directly against your actual target. If the figures don't align, you know immediately that something needs to change, whether that's your SIP amount, your timeline, or your fund selection.
This kind of check is something most investors skip entirely. They set up a SIP, automate the debit, and assume things are on track. Using a direct plan SIP calculator at least once a year keeps you honest about whether your portfolio is still aligned with your goals, and it prevents the unpleasant surprise of reaching your target date with a corpus that falls significantly short of what you actually need.
Direct vs regular plans and fee impact
When you invest in a mutual fund, you can choose between two plan types: direct and regular. The fund itself, its underlying stocks or bonds, and the fund manager are identical in both. The only difference is who gets paid along the way. Regular plans route your investment through a distributor or broker, and that intermediary earns a commission funded by a higher expense ratio charged to your investment. Direct plans eliminate the intermediary entirely, so the expense ratio is lower and more of your money stays invested and compounding.
What the Expense Ratio Difference Looks Like
The gap between direct and regular plan expense ratios varies by fund category but typically ranges from 0.5% to 1.5% annually. For equity mutual funds, this difference usually sits on the higher end of that range. That number might look minor on an annual basis, but compounding means the impact multiplies every year your money stays invested. A direct mutual fund SIP calculator makes this visible by letting you input two different return rates side by side and watching the final corpus numbers diverge over time.
Across a 15-year SIP in an equity fund, a 1% annual expense ratio difference can reduce your final corpus by 15–20%, depending on market conditions and fund category.
How the Fee Gap Compounds Over Time
Consider a straightforward example. You invest ₹10,000 per month for 20 years. A direct plan earns 12% annually while the equivalent regular plan earns 11% after its higher expense ratio. At 12%, your corpus reaches roughly ₹99.9 lakhs. At 11%, it reaches around ₹83.2 lakhs. That is a difference of more than ₹16 lakhs from a single percentage point, and the gap grows larger the more you invest and the longer your horizon extends.

Compounding works against you in regular plans because the expense ratio is charged on your growing corpus, not just your original invested amount. In early years, the rupee impact stays modest. But by year 10 or 15, the fund is charging that fee on a significantly larger base, which means the drag on your wealth accelerates precisely when your portfolio is at its most valuable. Switching to a direct plan stops that drag entirely, and those savings start compounding in your favor instead.
How a SIP calculator estimates returns
A direct mutual fund SIP calculator uses a standard compound interest formula adapted for periodic investments. Unlike a lump sum calculator, it accounts for the fact that each monthly installment enters the market at a different point in time, earns returns for a different duration, and compounds independently. Understanding how the math works helps you interpret the output intelligently instead of treating it as a black box.
The Formula Behind the Calculation
The core formula powering every SIP calculator is the future value of an annuity. In this formula, P represents your monthly SIP amount, r is the monthly rate of return (your annual rate divided by 12), and n is the total number of monthly installments. The calculator applies this across every installment to arrive at your projected final corpus at the end of your chosen tenure.
Each rupee you invest at month one compounds for the entire duration, while your last installment barely compounds at all, which is why starting early has such a disproportionate impact on your final number.
Each installment compounds separately from the others, and the calculator sums all those individual future values to produce the total. This is different from simply applying a return rate to your total invested amount, which would significantly understate your actual returns because it ignores the time-weighted compounding of each contribution.
What Each Input Controls
Three variables drive every output the calculator produces. Monthly investment amount scales the corpus proportionally: double your SIP and you roughly double the projected result, all else equal. Expected annual return rate has an exponential effect because higher returns compound on a growing base year after year, not just on your original contributions. Investment tenure is the most powerful lever of all, since extending your horizon by even five additional years can add crores to your final corpus purely through compounding.

Changing any one of these inputs shifts the result significantly. That is why the calculator is most useful when you run multiple scenarios back to back rather than just one. Try inputting a conservative 10% return rate alongside a more optimistic 13%, then compare the corpus figures for 10 years versus 20. The spread between scenarios shows you both the range of realistic outcomes and exactly how sensitive your final number is to small changes in return rate or time horizon.
How to use a direct mutual fund SIP calculator
Using a direct mutual fund SIP calculator takes less than two minutes, but getting the most out of it requires you to approach each input with intent rather than plugging in round numbers and accepting the first result. The sequence of steps is simple, but small choices at each stage significantly shape the output you get.
Enter Your Monthly SIP Amount
Start with the monthly investment amount you plan to commit. Be realistic here. Enter a figure that fits your actual budget after accounting for regular expenses, not an aspirational number you might struggle to sustain. If you are unsure, begin with your current SIP amount if you already have one running, or with roughly 20% of your monthly take-home pay as a starting point.
Set Your Expected Return Rate
This input requires some thought. Equity mutual funds in India have historically delivered 10%–13% annualized returns over long periods, while debt funds typically average closer to 6%–8%. Choose a rate that reflects the fund category you plan to invest in, and avoid selecting the highest possible rate just to inflate your projected corpus. Running the calculation at both a conservative and a moderate rate gives you a realistic range to plan around.
Use 10% as your baseline for equity SIPs and treat anything above 12% as an optimistic scenario, not a guaranteed outcome.
Choose Your Investment Tenure
Enter the number of years you plan to stay invested. Your tenure is the single most powerful variable in the calculation, far more impactful than small changes in return rate or monthly amount. Even extending your horizon by three to five additional years can add a substantial sum to your final corpus because compounding accelerates sharply in the later years of a long SIP.
Read and Act on the Results
Once you hit calculate, you will see your projected corpus and total invested amount side by side. The difference between these two figures is your estimated wealth gain. Do not stop at reading the number. Compare it directly against your actual financial goal, whether that is ₹50 lakhs for a house down payment or ₹2 crore for retirement. If the corpus falls short, adjust your SIP amount or tenure immediately until the projection aligns with your target.
Examples: calculate SIP returns for common goals
Running numbers through a direct mutual fund SIP calculator on hypothetical inputs teaches you less than working through goals you actually care about. The three examples below use realistic Indian financial targets, conservative return rate assumptions, and common SIP tenures so you can compare them directly against your own situation.
Building a ₹50 Lakh Education Fund
If your child is ten years old today and you need ₹50 lakhs in eight years for higher education, a direct plan equity SIP targeting 10% annual returns tells you that you need to invest roughly ₹35,000 per month. At 12%, the required monthly amount drops to approximately ₹29,000. That difference of ₹6,000 per month shows why the expense ratio gap between direct and regular plans carries real weight: in a regular plan, those savings disappear into distributor commissions rather than your corpus.
You can also run this scenario in reverse. If ₹35,000 per month is beyond your current budget, the calculator immediately tells you how far short you will land at ₹20,000 or ₹25,000, giving you time to course-correct by either adjusting the target or extending the horizon.
Reaching ₹1 Crore for Retirement
A 35-year-old targeting ₹1 crore by age 60 has a 25-year runway, which is where compounding does its heaviest lifting. At 12% annual returns in a direct equity fund, a monthly SIP of roughly ₹5,300 is enough to reach that target. At 11%, which is what a regular plan might deliver after its higher expense ratio, you need closer to ₹6,400 per month to hit the same corpus.

Switching to a direct plan at age 35 instead of a regular plan can mean needing ₹5,300 versus ₹6,400 monthly to reach the same ₹1 crore retirement goal, a gap of ₹1,100 per month over 25 years.
Saving ₹20 Lakhs for a House Down Payment
For a shorter, five-year goal like a house down payment, equity SIPs carry more volatility risk, so hybrid or debt-oriented funds at a conservative 8% return assumption are worth considering. At that rate, reaching ₹20 lakhs in five years requires a monthly SIP of approximately ₹27,000. Running this through the calculator also confirms whether the target is realistic for your income level, or whether extending the timeline to seven years reduces the monthly amount to something more manageable.
Common mistakes and limitations to know
A direct mutual fund SIP calculator is a powerful planning tool, but it works with assumptions, not certainties. Most investors treat the output as a promise rather than a projection, which leads to poor decisions when real-world results diverge from the screen. Knowing where the calculator falls short helps you use it correctly and avoid the most common planning errors.
Treating Projections as Guarantees
The return rate you enter is an assumption, and equity markets do not move in straight lines. Your actual fund returns will vary year by year based on market conditions, fund manager performance, and broader economic cycles. The calculator produces a smooth, linear estimate because it applies a single fixed rate across every year of your tenure, which is not how markets actually behave.
Think of the projected corpus as a realistic target to aim for, not a bank balance that will appear automatically at the end of your investment period.
Treating the output as guaranteed leads some investors to under-invest in the early years, assuming the math will take care of the shortfall later. That is a mistake. Start with a serious monthly amount and revisit the projection annually rather than assuming the first number you calculated will hold forever.
Ignoring Inflation in Your Target Corpus
If your goal is to accumulate ₹1 crore for retirement in 25 years, that ₹1 crore will have significantly less purchasing power than it does today. A calculator shows you the nominal future corpus, not the inflation-adjusted value of what you will actually be able to buy with that money. Inflation in India has historically averaged around 5%–6% annually, which erodes the real value of your corpus substantially over long horizons.
When you set your target corpus, build in an inflation buffer by increasing it by roughly 5% per year for every year in your investment timeline. This adjustment alone can mean the difference between a retirement corpus that covers your actual expenses and one that leaves you short.
Overlooking Step-Up SIPs
Most calculators default to a fixed monthly investment throughout your chosen tenure. But your income will likely grow over time, and a flat SIP amount means your real contribution actually shrinks in purchasing power terms each year. Running a step-up SIP scenario, where you increase your monthly investment by 10%–15% annually, gives you a far more accurate picture of what disciplined, income-linked investing can realistically produce.
Next steps
You now have everything you need to use a direct mutual fund SIP calculator with confidence. You understand what drives the output, how the expense ratio gap between direct and regular plans compounds into a significant corpus difference over time, and where the calculator's built-in limitations can mislead you if you treat projections as fixed outcomes. The math consistently favors direct plans, and the longer your investment horizon, the larger that advantage grows.
Your next move is to stop estimating and start calculating. Run your actual financial goals through a calculator, set a realistic monthly SIP amount, and make sure you are investing in direct plans rather than regular ones. If you want personalized, conflict-free advice backed by AI-driven insights and the credibility of a SEBI Registered Investment Advisor, start your wealth journey with Invsify and get recommendations built around your specific goals, risk profile, and investment timeline.
