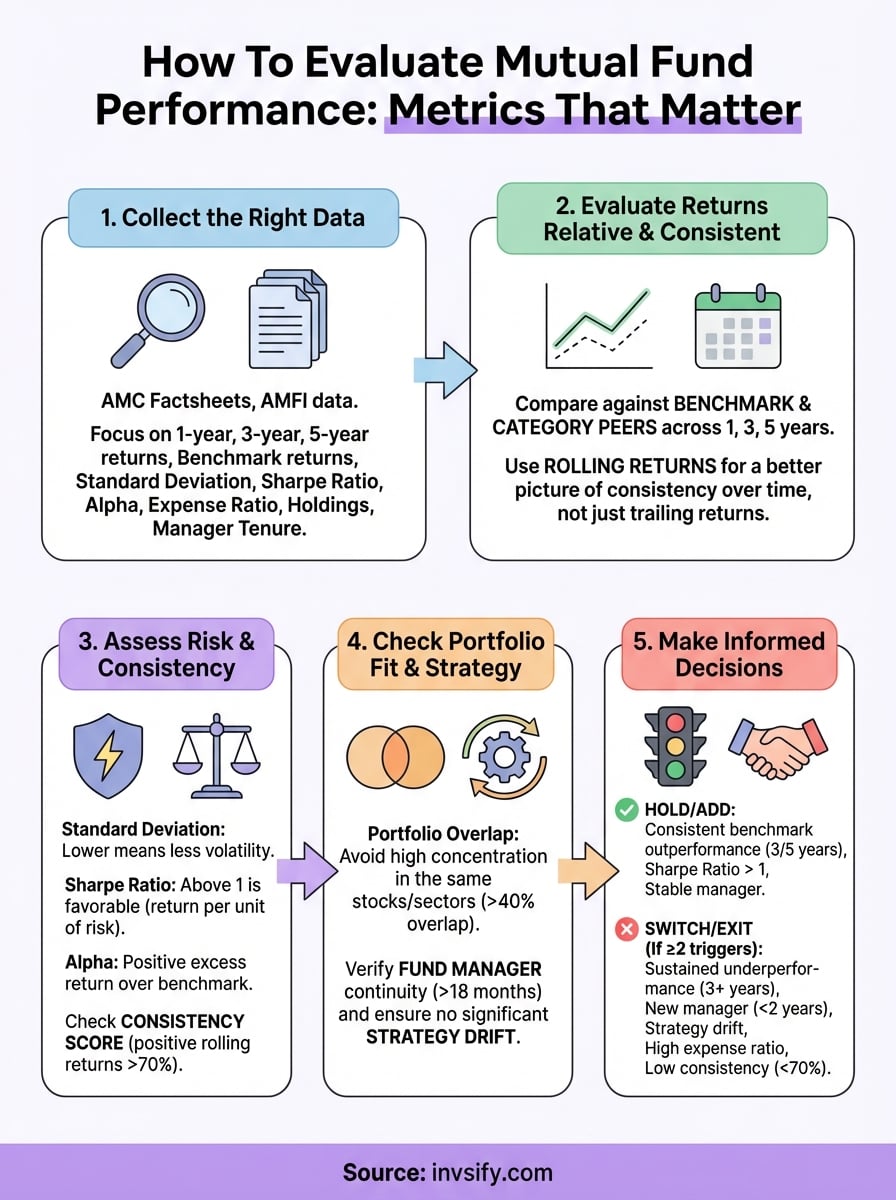
How To Evaluate Mutual Fund Performance: Metrics That Matter
Shlok Sobti

How To Evaluate Mutual Fund Performance: Metrics That Matter
You picked a mutual fund, invested your money, and now you're staring at a number on your screen. Is it good? Should you stay or exit? Most investors in India struggle with exactly this, not the investing part, but the evaluating part. Knowing how to evaluate mutual fund performance is arguably more important than picking the fund in the first place, yet it rarely gets the attention it deserves.
The problem is that most people default to one metric: returns. If the fund gave 15%, it must be great, right? But that number alone tells you almost nothing. What benchmark did it beat, or miss? How much risk did the fund manager take to generate those returns? What's the expense ratio quietly eating into your gains? These are the questions that separate informed investors from hopeful ones.
This guide breaks down the exact metrics that matter when you assess your mutual funds, from risk-adjusted returns and benchmark comparisons to peer analysis, portfolio overlap, and consistency of performance. At Invsify, our AI-powered advisory tools are built to surface precisely these insights, cutting through the noise so you can make clear, data-backed decisions about whether to hold, switch, or exit. No guesswork, no vague advice from online forums, just the numbers that actually count.
What good mutual fund performance looks like
Good performance is not a single number on your statement. When you think about how to evaluate mutual fund performance, the first shift you need to make is from absolute returns to relative, risk-adjusted, and consistent performance measured across multiple dimensions. A fund that delivered 18% last year sounds impressive until you learn its benchmark index returned 22% in the same period, or that it took on twice the volatility to get there.
Returns relative to a benchmark, not just absolute numbers
Every mutual fund in India has a designated benchmark index. For a large-cap equity fund, that benchmark is often the Nifty 50 or the BSE Sensex. For a mid-cap fund, it might be the Nifty Midcap 150. Your fund's job is to beat that benchmark consistently over meaningful time periods, not just for one quarter. If a fund consistently underperforms its benchmark, the fund manager is not adding value, and you are paying fees for results you could have gotten from a low-cost index fund.
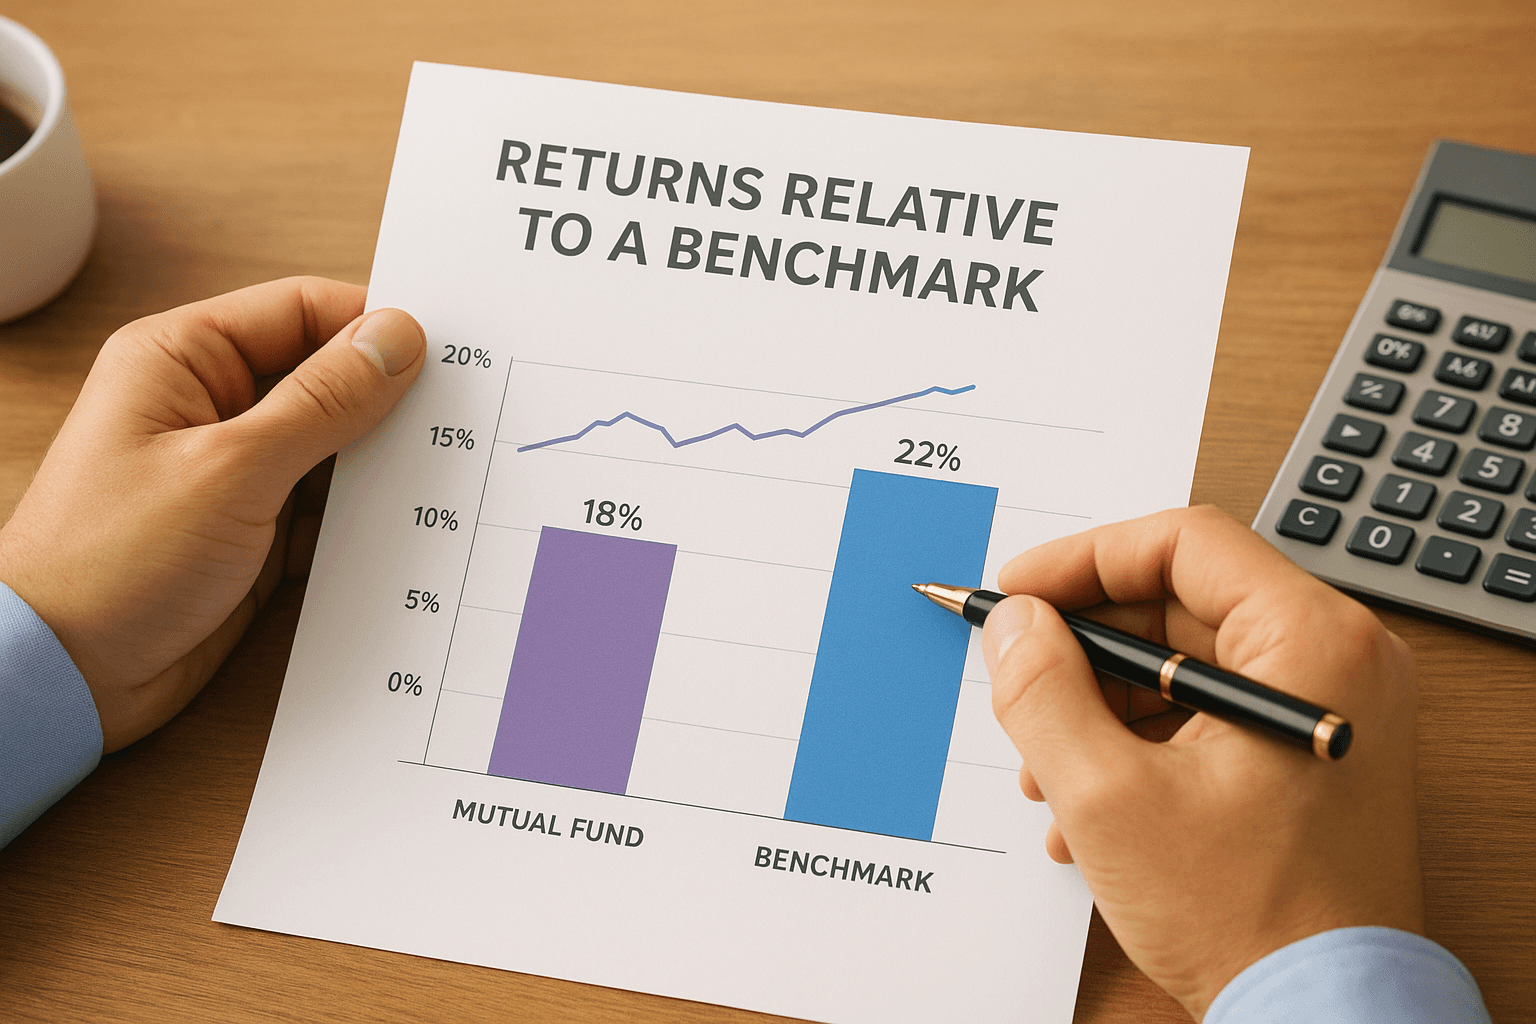
When you compare returns to a benchmark, use the same time period for both. Look at 1-year, 3-year, and 5-year trailing returns side by side. A fund that beats the Nifty 50 by 2-3% annually over five years, while maintaining similar volatility, is genuinely delivering alpha. A fund that beat the benchmark once during a bull run and lagged in every other period is not.
Alpha generation over a full market cycle, including both rising and falling markets, is a far stronger indicator of fund manager skill than a single year's return.
Consistency across market cycles
A one-year performance figure is nearly meaningless on its own. Markets move in cycles, and a fund that looked exceptional in 2023 may have simply ridden a sector tailwind. What you want to see is consistent outperformance across different market phases, including downturns, recoveries, and sideways markets. This tells you the fund manager has a repeatable investment process, not just good timing.
Look at calendar-year returns for each of the past five years. If your fund beat its benchmark in four of those five years, that's a strong consistency signal. If it only outperformed during one exceptional bull year and lagged in all others, treat that as a warning sign rather than a green light.
The role of risk in defining "good"
Returns without risk context are incomplete. A fund that generated 20% returns by concentrating heavily in two or three sectors is not the same as a fund that generated 18% with a well-diversified, lower-volatility portfolio. The second fund may actually be the better choice, particularly if you're investing toward a goal like retirement or a child's education where capital protection matters alongside growth.
Two numbers help you see risk clearly. Standard deviation tells you how much the fund's returns bounced around the average, with a higher number meaning a bumpier ride. Sharpe ratio tells you how much return the fund generated per unit of risk taken. A Sharpe ratio above 1 is generally considered favorable, and higher is better. When you compare two funds with similar returns, always favor the one with the lower standard deviation and the higher Sharpe ratio.
Metric | What it measures | What to look for |
|---|---|---|
Alpha | Excess return over the benchmark | Positive and consistent across periods |
Standard deviation | Volatility of returns | Lower means more stable performance |
Sharpe ratio | Return earned per unit of risk taken | Above 1 is favorable |
Benchmark comparison | Relative performance vs. index | Consistent outperformance over 3-5 years |
These four metrics together give you a baseline framework. A fund can score well on all four and still have issues you haven't spotted yet, which is why the steps that follow matter just as much.
Step 1. Collect the right data before you judge
Before you can begin to evaluate mutual fund performance, you need the right data in front of you. Many investors skip this step and rush straight to comparing return numbers from memory or a single fund house brochure. That approach leads to bad conclusions. Garbage data produces garbage decisions, so start by pulling accurate, complete, and standardized information from the right sources.
Where to find reliable fund data
Your fund house's website gives you basic NAV history and factsheets, but that is only the starting point. For standardized, comparable data across fund houses, use AMFI (Association of Mutual Funds in India), which publishes official NAV data and categorized fund information. For deeper metrics like Sharpe ratio, standard deviation, alpha, and rolling returns, the fund's factsheet released monthly by the AMC is your primary document. Each AMC is required to publish these factsheets, and they are available directly on their official websites.
Always use the same data source when comparing two funds, mixing sources introduces inconsistencies that make comparisons meaningless.
What data points to collect
Pull the following data before you make any judgment. This list covers everything you need across the key evaluation steps in this guide.
Data point | Where to find it | Why it matters |
|---|---|---|
1-year, 3-year, 5-year returns | AMC factsheet | Measures performance across different periods |
Benchmark returns (same periods) | AMC factsheet or AMFI | Required for relative performance comparison |
Standard deviation | AMC factsheet | Tells you how volatile the fund has been |
Sharpe ratio | AMC factsheet | Measures return per unit of risk |
Alpha | AMC factsheet | Shows value added over the benchmark |
Expense ratio | AMC factsheet or SEBI filings | Reveals the annual cost you are paying |
Portfolio holdings (top 10) | AMC factsheet | Shows sector exposure and concentration |
Fund manager tenure | AMC factsheet | Helps you assess if past performance is attributable to the current manager |
Once you have this data, organize it in a simple spreadsheet with one column per fund and one row per metric. This structure makes side-by-side comparison immediate and clear. If you are evaluating multiple funds across categories, maintain separate tabs for each category so you are only comparing funds that share the same benchmark and investment objective. Comparing a mid-cap fund to a large-cap fund on raw returns alone is like comparing apples to mangoes, the context is completely different.
Step 2. Compare returns using the right lenses
Once you have your data organized, the next move is to compare returns accurately. Raw return numbers mislead you when you look at them without the right frame. Trailing returns show you how a fund performed up to today from a fixed past point, but they shift every single day and can flatter or penalize a fund depending on market timing. Rolling returns give you a much more honest picture by measuring performance across all possible start and end dates within a period.
Trailing returns vs. rolling returns
Trailing returns are what most fund screeners show you by default. A 3-year trailing return tells you the CAGR from exactly three years ago to today. The problem is that a single bad month at either end of that window can make a strong fund look weak, or a weak fund look strong. Rolling returns solve this by calculating CAGR for every 3-year window within your chosen period, say January 2019 to December 2024, and then averaging those results.
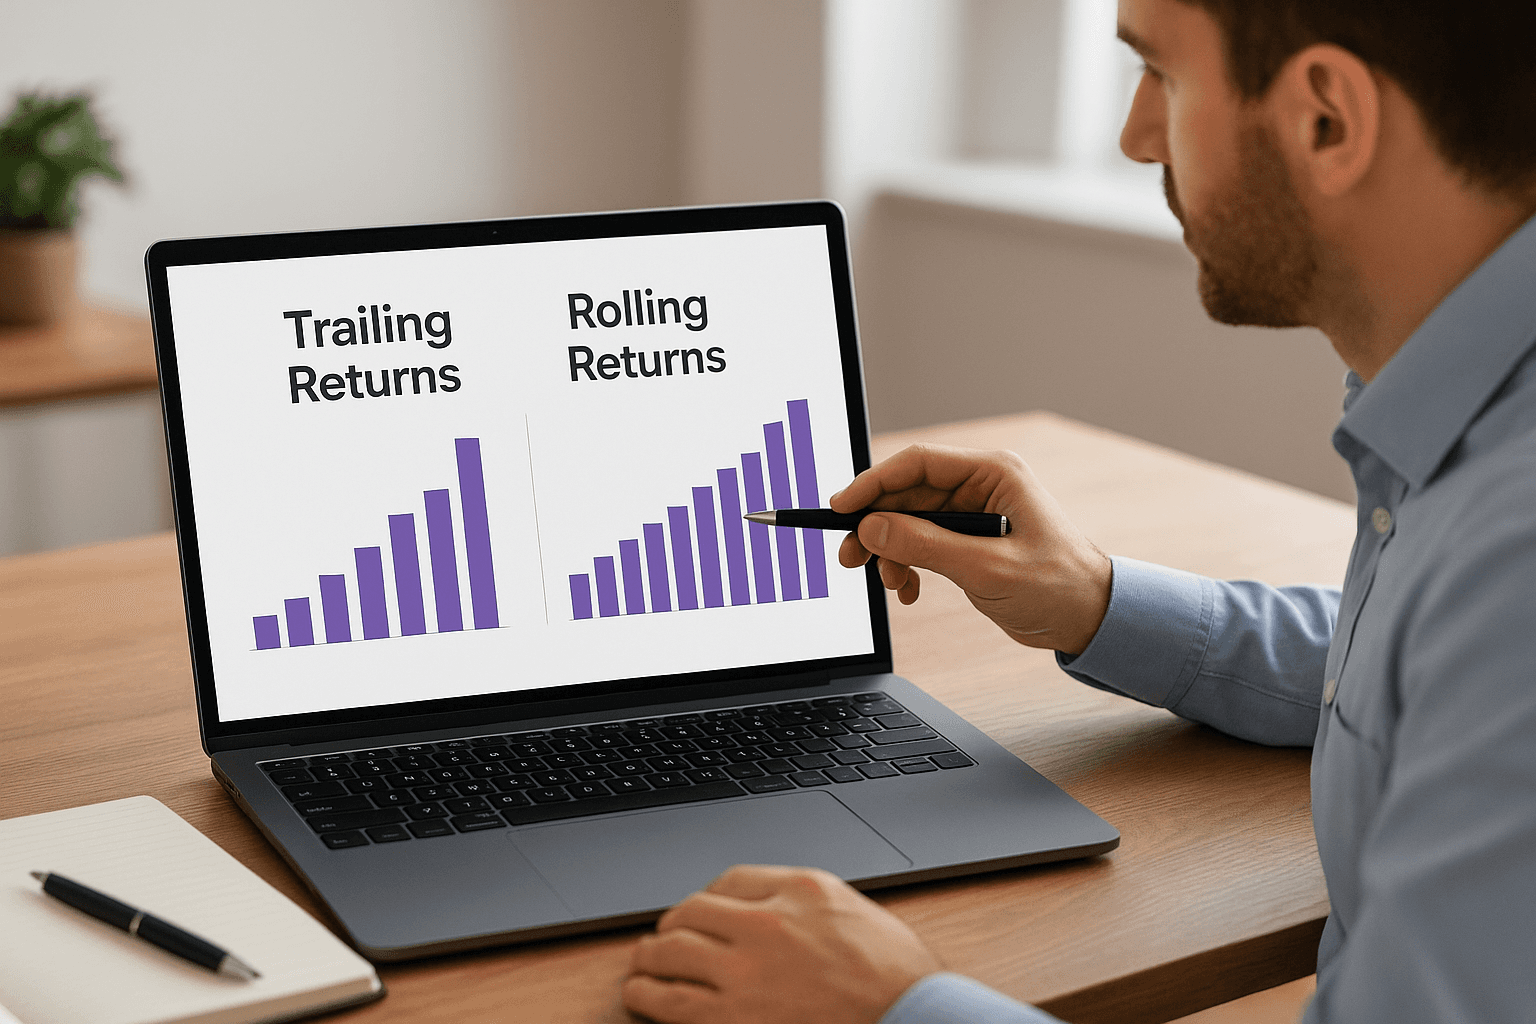
To calculate rolling returns manually, pull monthly NAV data from the AMC factsheet or AMFI, then compute the CAGR for each rolling window of your chosen length (1-year, 3-year, or 5-year). The percentage of times the fund delivered a positive return across all those windows is called the consistency score, and it tells you far more than a single trailing number.
A fund that delivered positive rolling 3-year returns in 90% of all historical windows is demonstrably more reliable than one with a higher average trailing return but wide variation in outcomes.
Compare against your fund's category average
Benchmark comparison tells you whether the fund beat the index, but category average comparison tells you whether the fund beat its peers. Both checks matter. A large-cap fund that beats the Nifty 50 by 1% but sits at the bottom of its category is still a below-average choice. AMFI categorizes funds so that you are always comparing like with like: large-cap against large-cap, flexi-cap against flexi-cap.
When you understand how to evaluate mutual fund performance properly, this two-layer comparison becomes a standard habit. First, check if the fund beat its designated benchmark index across 1, 3, and 5-year periods. Second, check where it ranks within its AMFI category for the same periods. A fund that clears both hurdles consistently earns a passing grade on returns. One that clears only one, or neither, needs a closer look before you commit more money to it.
Step 3. Measure risk and consistency, not just returns
Returns tell you what a fund earned. Risk metrics tell you what the fund risked to earn it, and consistency checks tell you whether that performance was repeatable or just fortunate timing. This is where most retail investors stop doing the work, and it is precisely where the most important signals live. Once you understand how to evaluate mutual fund performance across both risk and consistency dimensions, you stop being caught off guard when a seemingly strong fund collapses in a downturn.
The key risk metrics to calculate
Standard deviation and Sharpe ratio are the two numbers you must pull from the AMC factsheet before drawing any conclusion about a fund's risk profile. Standard deviation measures how far the fund's monthly returns deviated from its own average. A fund with a standard deviation of 18% experienced far more volatility than one with 12%, even if both ended the year at the same total return. The Sortino ratio refines the Sharpe ratio by penalizing only downside volatility, making it especially useful for funds you hold toward a specific goal like retirement or a child's education.
Here is how to interpret these three metrics together:
Metric | Calculation basis | What a strong result looks like |
|---|---|---|
Standard deviation | Monthly return variation from the mean | Lower than the category average |
Sharpe ratio | (Fund return - Risk-free rate) / Standard deviation | Above 1.0, higher than peers |
Sortino ratio | (Fund return - Risk-free rate) / Downside deviation | Above 1.5 signals strong downside protection |
Use the 91-day T-bill rate published by the Reserve Bank of India as your risk-free rate when calculating Sharpe and Sortino ratios manually.
How to check for consistency
Rolling return analysis, which you already ran in Step 2, doubles as a direct consistency test. Count how many rolling windows produced a positive return, then divide by the total number of windows measured. If a fund delivered positive 3-year rolling returns in 85 out of 95 windows, its consistency score sits at roughly 89%, which is strong. Anything below 70% should prompt serious scrutiny before you commit additional capital.
Pair that score with a maximum drawdown check. Maximum drawdown is the largest peak-to-trough decline the fund experienced across your measurement period. Pull the monthly NAV history from the AMC factsheet, identify the highest NAV before a sustained decline, and measure how far it fell before recovering. A fund that dropped 40% during a broad market correction while its category average dropped 28% is carrying concentration or liquidity risk that the Sharpe ratio alone will not surface.
Step 4. Review portfolio fit and fund strategy
Even a fund with strong risk-adjusted returns can be a poor choice if it doesn't fit your existing portfolio or if its strategy has quietly shifted since you first invested. When you think about how to evaluate mutual fund performance, this step forces you to zoom out from raw metrics and ask a different question: does this fund still serve the role you originally assigned it within your overall financial plan?
Check for portfolio overlap
Portfolio overlap happens when two funds you hold buy the same stocks in significant quantities, which means you think you are diversified but you are actually doubling down on the same bets. Pull the top 10 holdings from each fund's monthly AMC factsheet and compare them side by side. If your large-cap fund and your flexi-cap fund both hold Reliance Industries, HDFC Bank, and Infosys in their top five, you have meaningful concentration risk that reduces the actual diversification benefit of holding both.
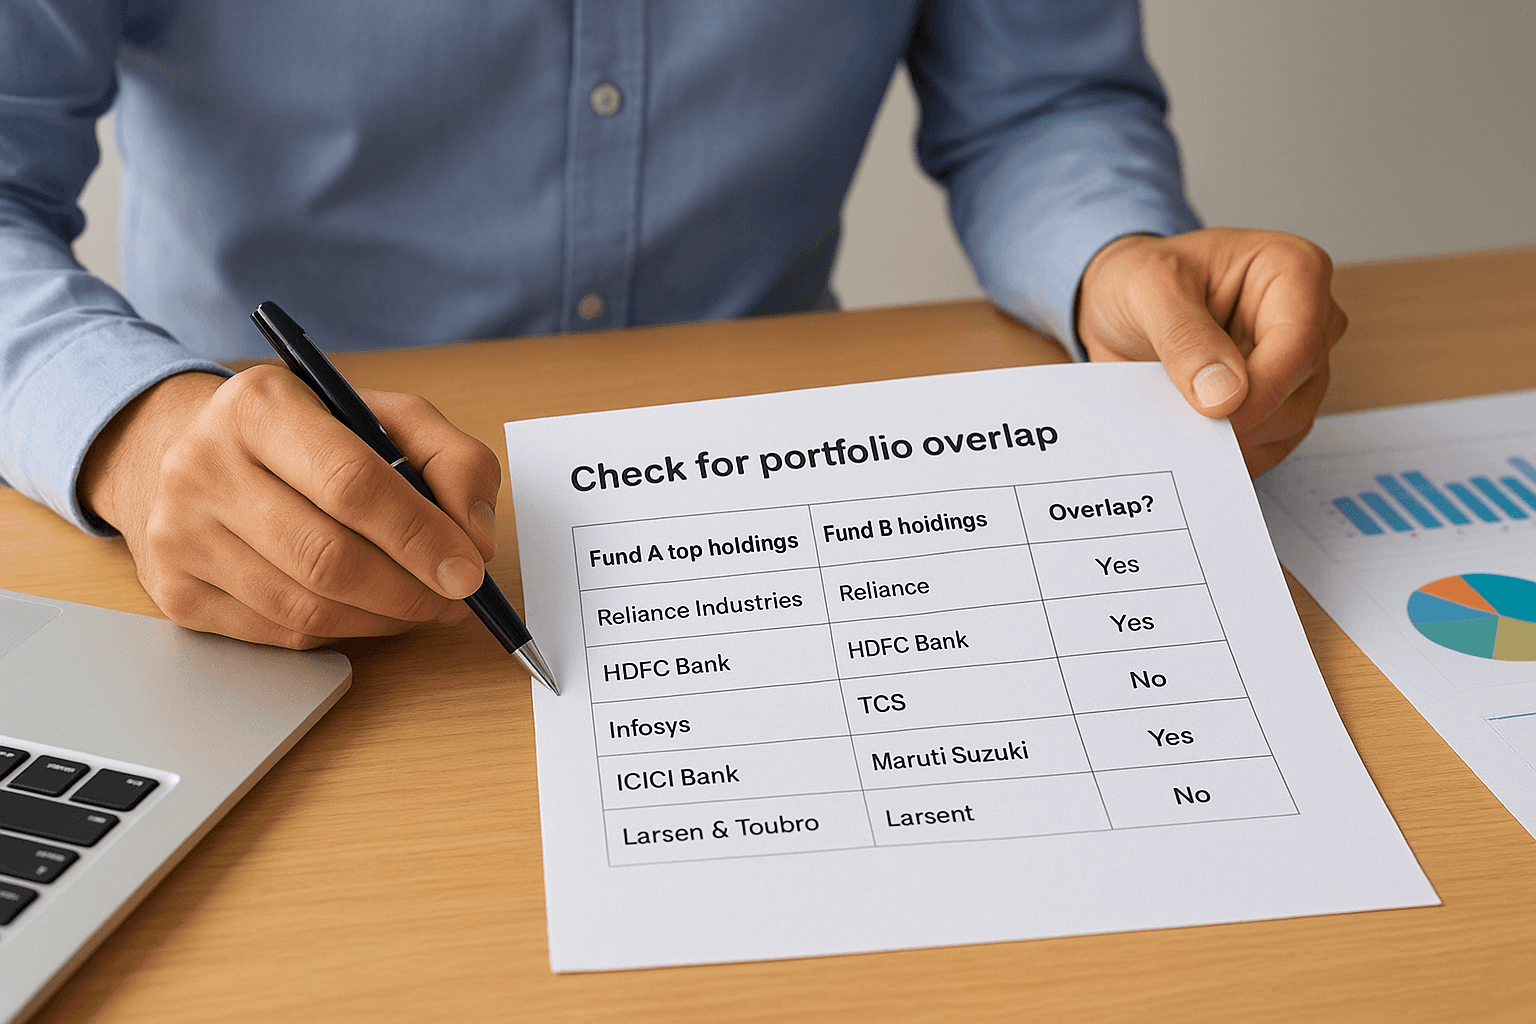
A quick way to track overlap:
Fund A top holdings | Fund B top holdings | Overlap? |
|---|---|---|
Reliance Industries | Reliance Industries | Yes |
HDFC Bank | HDFC Bank | Yes |
Infosys | TCS | No |
ICICI Bank | Infosys | Yes |
Larsen & Toubro | Maruti Suzuki | No |
If more than 40% of holdings overlap across two funds you own, seriously reconsider whether holding both adds genuine diversification or simply increases your portfolio complexity without any added benefit.
Verify the fund manager and strategy haven't shifted
Fund manager continuity matters more than most investors realize. The performance record you evaluated in the earlier steps belongs to whoever managed the fund during that period. If the fund manager changed within the last 12 to 18 months, treat the historical performance as only partially relevant to your forward-looking decision. Check the AMC factsheet for the current manager's name, their tenure on this specific fund, and their track record on any previous funds they managed.
A fund that changed its manager and quietly shifted from a value-oriented strategy to a momentum-driven one is no longer the same product you evaluated at entry.
Strategy drift is the second thing to verify here. Read the fund's investment objective and the fund manager's commentary in the latest factsheet. Compare the current sector allocation to what it looked like 12 months ago. If a fund marketed as a defensive large-cap play now holds 30% in mid-cap or small-cap stocks, that is strategy drift, and it changes your risk exposure in ways the fund's category label alone will not alert you to.
Step 5. Decide when to hold, add, switch, or exit
The data you have collected across the previous four steps only has value if it drives a clear decision. This is where knowing how to evaluate mutual fund performance pays off directly. Most investors sit in underperforming funds for years because they mistake inertia for patience. The framework below gives you a structured way to act on your findings rather than stall on them.
When to hold or add more
You hold a fund when it continues to do the job you hired it for. Specifically, hold when the fund has beaten its benchmark in at least three of the last five calendar years, its Sharpe ratio sits above 1.0, and the fund manager has not changed in the past 18 months. Minor short-term underperformance of 1 to 2% relative to the benchmark in a single quarter is not a sell signal. Markets move in cycles, and even strong fund managers go through brief rough patches that reverse without any action from you.
Add more to a fund when it scores well on all your risk and consistency checks, the underlying market segment it targets aligns with your current financial goal, and you have confirmed through your overlap check that adding more does not over-concentrate your portfolio in the same stocks or sectors.
Patience is a position only when the data supports it. If you are holding because you cannot bring yourself to act on clear warning signs, that is not patience, that is avoidance.
When to switch or exit
Switch or exit a fund when at least two of the following conditions are true simultaneously, not just one in isolation:
Trigger | Threshold that signals action |
|---|---|
Sustained benchmark underperformance | Lagging the benchmark for 3 or more consecutive years |
Fund manager change | New manager with less than 2 years on this fund and no comparable track record |
Strategy drift | Current sector allocation has shifted more than 20 percentage points from stated mandate |
High expense ratio | Direct plan expense ratio exceeds 1.5% for equity or 0.5% for debt |
Consistency score | Positive rolling 3-year returns in fewer than 70% of all windows |
When two or more triggers fire at once, the fund has structurally changed and your original investment case no longer holds. Exit or switch to a fund in the same AMFI category that clears your benchmark, risk, and consistency checks. Always switch within the same asset class to avoid disrupting your overall portfolio allocation, and check the tax implications of redemption based on your holding period before you act.
Final checklist and next step
Knowing how to evaluate mutual fund performance is a repeatable skill, not a one-time task. Run through this checklist every six months or whenever you add a new fund to your portfolio.
Compare 1-year, 3-year, and 5-year returns against the fund's designated benchmark
Calculate the Sharpe ratio and standard deviation from the latest AMC factsheet
Run a rolling return consistency check and confirm the score exceeds 70%
Verify the fund manager has not changed in the past 18 months
Check portfolio overlap across all funds you currently hold
Review the expense ratio against category averages
Apply the switch or exit trigger table if two or more warning signs appear simultaneously
If any of these checks surface concerns you cannot resolve on your own, you do not have to figure it out alone. Get AI-powered, conflict-free advice from Invsify and let data-backed recommendations guide your next move with full transparency.
