Moneycontrol Mutual Fund Comparison: How To Compare Funds
Shlok Sobti

Moneycontrol Mutual Fund Comparison: How To Compare Funds
Picking the right mutual fund from thousands of options can feel overwhelming. That's where Moneycontrol mutual fund comparison tools come in handy, they let you stack funds side by side and evaluate what actually matters: returns, risk, expense ratios, and category performance.
But here's the thing: having access to comparison data is just step one. Understanding what those numbers mean for your specific financial goals is where the real value lies. At Invsify, we combine AI-driven insights with SEBI-registered advisory expertise to help you move beyond raw data and make confident investment decisions.
This guide walks you through exactly how to use Moneycontrol's comparison feature effectively. You'll learn which parameters to prioritize, how to interpret the results, and avoid common mistakes that lead to poor fund selection. Whether you're comparing large-cap funds or evaluating SIP returns across categories, this step-by-step breakdown has you covered.
What Moneycontrol fund comparison shows
The moneycontrol mutual fund comparison tool displays a comprehensive side-by-side view of key metrics that directly impact your investment decisions. You'll see performance data across multiple time periods, starting from one-month returns all the way to ten-year returns, which helps you spot consistency patterns that matter more than any single year's performance.
Key performance metrics you'll see
Moneycontrol breaks down returns into calendar year performance and rolling period returns, both of which tell you different stories about fund behavior. You'll also find SIP return calculators that show what your systematic investments would have grown to over specific periods. The platform displays NAV trends through interactive charts, making it easy to visualize how each fund has moved compared to its benchmark and category average.
The comparison tool also reveals expense ratios, which directly eat into your returns over time.
Portfolio and fund characteristics displayed
Beyond returns, you'll access complete portfolio holdings for each fund, including top ten stocks, sector allocation, and asset distribution between equity and debt. The tool shows fund manager tenure and Assets Under Management (AUM), both critical factors that indicate stability and conviction. You'll see exit load structures and minimum investment requirements, which affect your liquidity and entry point. Risk metrics like standard deviation and Sharpe ratio appear in the comparison view, helping you understand volatility versus reward. Each fund's category ranking and star rating give you quick context on how it stacks up against peers in the same investment universe.
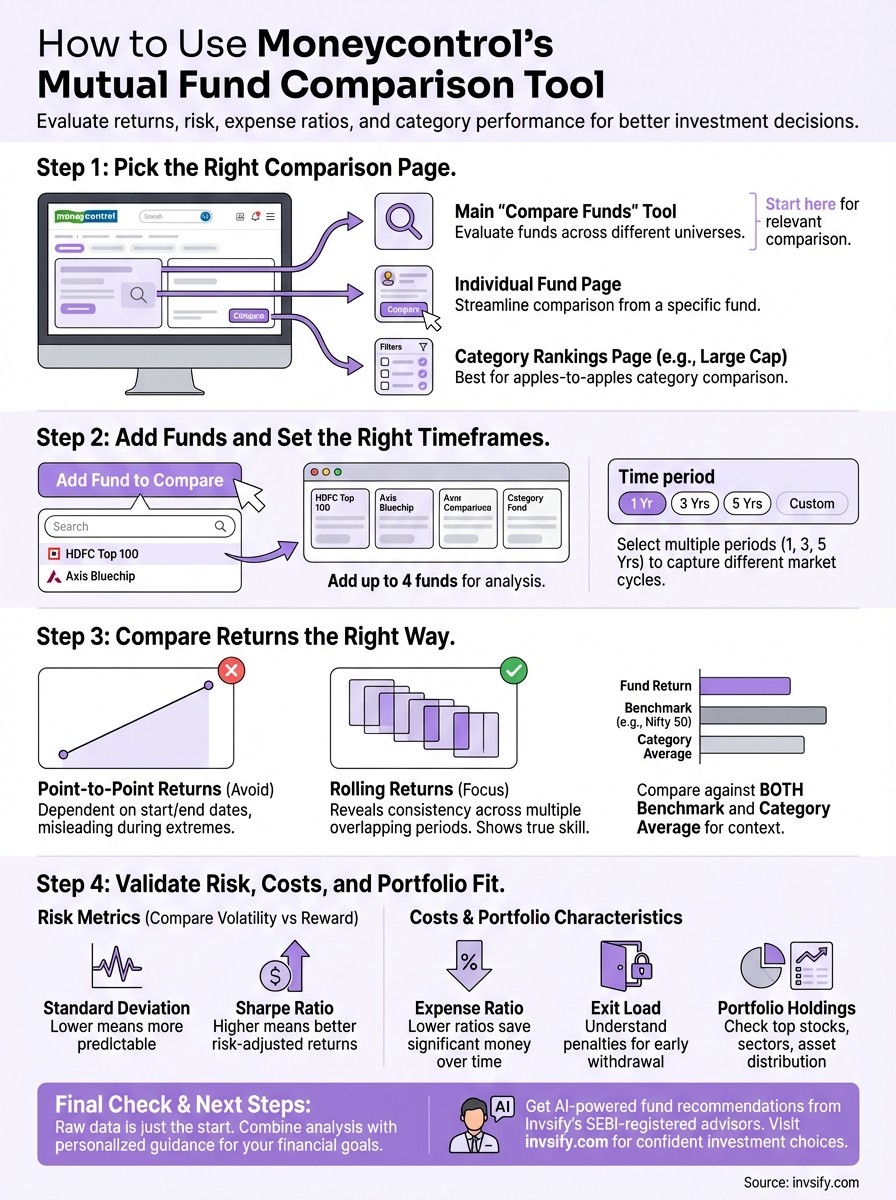
Step 1. Pick the right Moneycontrol comparison page
Moneycontrol offers multiple entry points for fund comparison, and starting from the right page saves you time and gives you access to category-specific benchmarks. You need to understand which comparison tool matches your evaluation needs before adding funds to compare.
The main comparison options
Navigate to Moneycontrol's mutual fund section and you'll find three primary comparison pathways. The first is the general "Compare Funds" tool under the main navigation, which lets you pick any funds across categories. This works well when you're evaluating funds from different investment universes, like comparing a large-cap fund against a flexi-cap option.
The second pathway appears on individual fund pages through the "Compare" button, which pre-populates that specific fund and suggests similar category peers. This approach streamlines your workflow when you've already shortlisted one fund and want to evaluate alternatives.
Starting from a category-specific page automatically filters funds by investment style, making your comparison more relevant.
Your third option involves accessing the category rankings page first (like "Large Cap Funds" or "Mid Cap Funds"), then selecting multiple funds from that filtered list. This method ensures you're comparing apples to apples within the same investment mandate, which makes performance evaluation more meaningful and fair.
Step 2. Add funds and set the right time frames
Once you've selected your comparison page, you need to add specific funds and configure the time period parameters that match your investment horizon. The moneycontrol mutual fund comparison interface lets you add up to four funds simultaneously, which gives you enough data points without overwhelming your analysis.
How to add funds to compare
Click the "Add Fund to Compare" button and you'll see a search box where you can type fund names or AMC names. Moneycontrol displays results as you type, showing fund category and AUM next to each option to help you identify the right scheme quickly. You can search using partial names like "HDFC Top 100" or "Axis Bluechip" and the autocomplete feature will surface relevant matches.
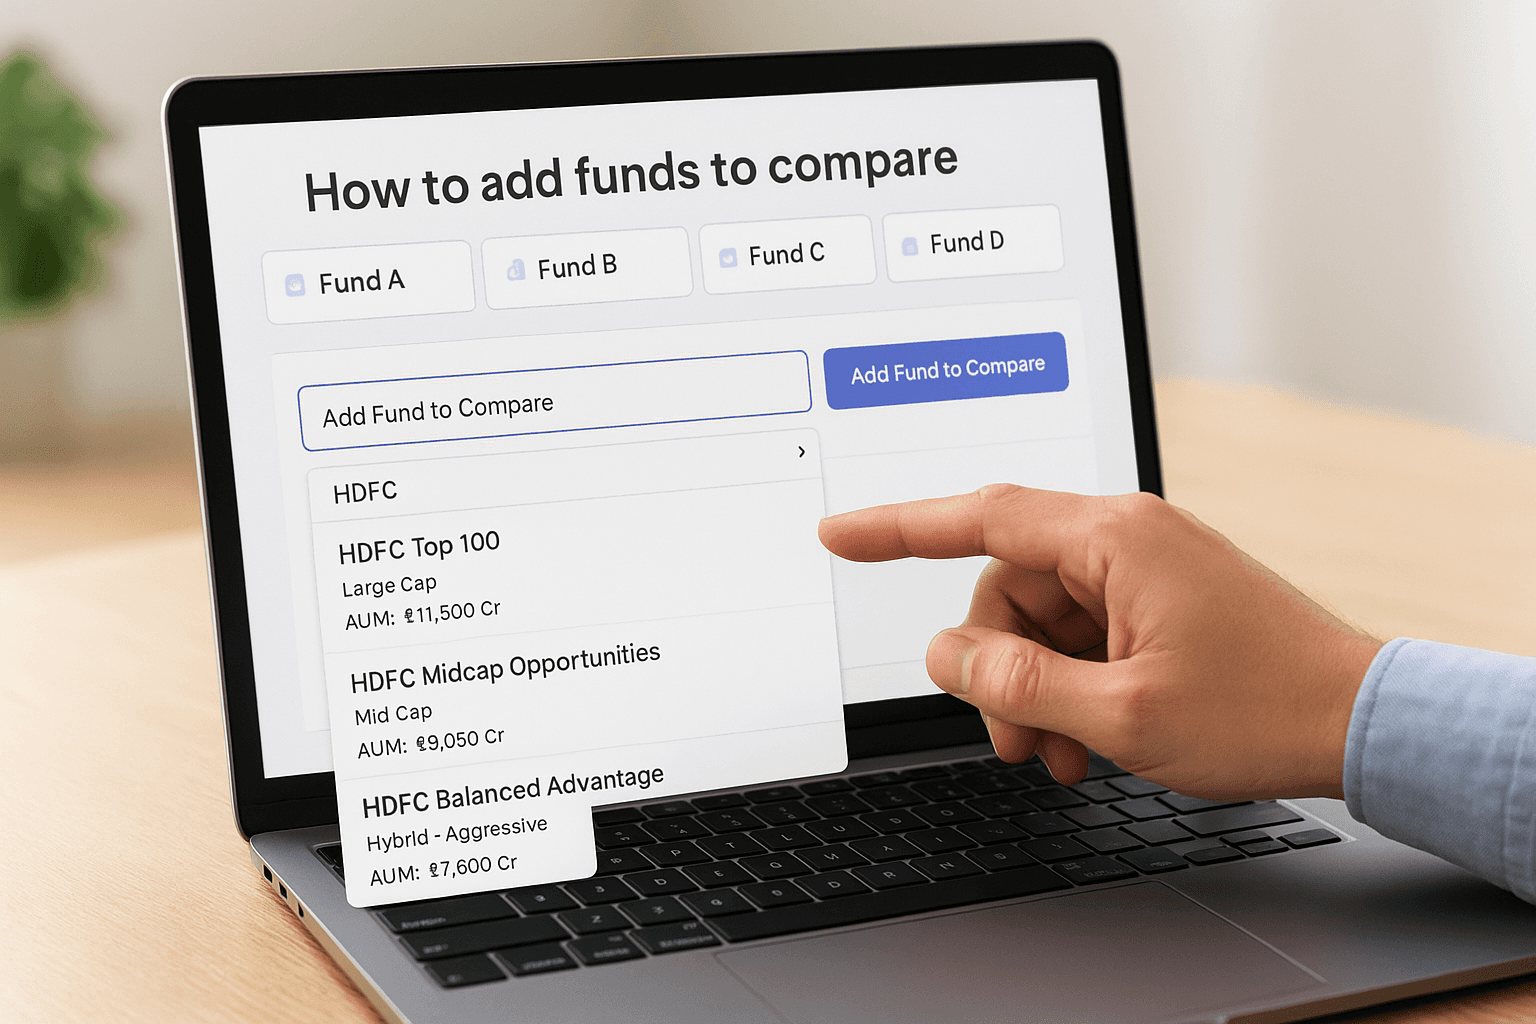
After selecting your first fund, repeat the process for each additional fund you want to evaluate. The interface displays all selected funds in horizontal cards at the top of the comparison page, making it easy to remove or replace any fund before running your analysis.
Adding funds from the same category (like all large-cap funds) makes your comparison more meaningful than mixing unrelated investment styles.
Setting comparison timeframes
Choose multiple time periods rather than relying on a single timeframe, because short-term performance can be misleading. Select at least three periods: one year, three years, and five years to capture different market cycles. Moneycontrol automatically displays returns across standard periods, but you can adjust the date range using the custom filter option at the top of the comparison view.
Step 3. Compare returns the right way
Looking at raw return numbers without context leads to poor investment decisions. The moneycontrol mutual fund comparison tool displays returns across different periods, but you need to interpret them correctly by comparing against benchmarks and understanding what drives performance differences.
Focus on rolling returns over point-to-point
Point-to-point returns depend heavily on start and end dates, which can paint a misleading picture during market extremes. Rolling returns show you how a fund performed across multiple overlapping periods, revealing consistency patterns that matter more than any single high-return year. Check if a fund consistently beats its benchmark across rolling three-year and five-year windows, not just during the most recent bull run.

Funds that show steady outperformance across rolling periods demonstrate skill, not just luck with timing.
Check returns against category average and benchmark
Compare each fund's performance against two reference points: its category average and its stated benchmark index. A large-cap fund should beat both the Nifty 50 index and the average of all large-cap funds to justify your selection. Look for funds that outperform by at least 1-2% annually after accounting for expense ratios, because smaller margins often disappear after taxes and transaction costs.
Step 4. Validate risk, costs, and portfolio fit
Returns tell only half the story, you need to examine risk metrics and cost structures that directly impact your actual returns. The moneycontrol mutual fund comparison displays volatility measures, expense ratios, and portfolio characteristics that help you assess whether a fund matches your risk tolerance and investment goals.
Check standard deviation and volatility metrics
Look at standard deviation numbers in the comparison table to understand how much each fund's returns fluctuate. A lower standard deviation means more predictable returns, while higher values indicate bigger swings that might not suit conservative investors. Compare the Sharpe ratio across funds to see which one gives you better returns per unit of risk taken.
Funds with higher Sharpe ratios deliver better risk-adjusted performance, making them smarter choices for most investors.
Evaluate expense ratios and exit loads
Examine the expense ratio for each fund because a difference of even 0.5% compounds into significant money over ten years. Direct plans typically cost 0.5% to 1% less than regular plans, which translates to thousands saved on a large portfolio. Check exit load structures to understand penalties for early withdrawal, especially if you might need liquidity within one to two years of investing.
Quick recap and what to do next
You now know how to use the moneycontrol mutual fund comparison tool to evaluate funds based on returns, risk metrics, expense ratios, and portfolio holdings. Start by picking the right category page, add up to four funds that match your investment style, and examine performance across multiple time periods using rolling returns instead of point-to-point data. Compare each fund against its benchmark and category average, then validate risk levels through standard deviation and Sharpe ratios before making your final decision.
Raw comparison data only gets you halfway there. You need personalized guidance that factors in your specific financial goals, tax situation, and risk appetite to make truly confident investment choices. Get AI-powered fund recommendations from Invsify's SEBI-registered advisors who analyze your complete financial picture and suggest funds that actually fit your wealth-building strategy, not just the ones with the highest recent returns.
