NSE India Official Website: A Complete Guide for Investors
Shlok Sobti

NSE India Official Website: A Complete Guide for Investors
The NSE India official website is your direct gateway to real-time market data from the National Stock Exchange, India's largest stock exchange by trading volume. You can track NIFTY indices, check live share prices, review corporate filings, and analyze derivatives data all from this single platform. Think of it as the source where brokers, financial advisors, and individual investors pull their market information.
This guide walks you through everything the NSE website offers and shows you how to use it effectively. You'll learn to navigate the platform's key sections, understand option chains and derivatives data, access corporate announcements, and find historical pricing information. More importantly, you'll discover how to move beyond just consuming raw numbers to making informed investment decisions. Whether you're tracking your portfolio's performance or researching new opportunities, knowing your way around this official resource gives you the same data advantages that professional traders rely on daily.
Why the NSE website is crucial for Indian investors
The NSE India official website gives you unfiltered access to primary market data that hasn't passed through any third-party interpretation or delay. You're seeing the same information that institutional investors and market analysts rely on, which puts you on equal footing when making investment decisions. Every stock price update, index movement, and corporate filing appears here first before trickling down to news websites, broker platforms, or financial apps.
Direct access to unfiltered market information
You bypass the noise when you pull data directly from the source. Financial news websites often add their own spin to market movements, while broker platforms might highlight products that benefit their business rather than your portfolio. The NSE website shows you raw numbers without editorial bias or commercial motivation.
This direct access matters especially during volatile market conditions when delays of even a few minutes can cost you money. While aggregator websites might lag by five to ten minutes, the NSE platform updates in near real-time. You can track price movements, order book depth, and trading volumes as transactions actually happen rather than reading about them after the fact.
When market corrections hit, the difference between real-time data and delayed information can determine whether you protect your capital or watch it evaporate.
Regulatory compliance and corporate governance insights
Companies listed on NSE must disclose material information through official filings that appear on this platform. You can read about board meetings, financial results, dividend announcements, and management changes directly from the company's submissions. These corporate disclosures follow SEBI regulations, which means they contain verified information rather than rumors or speculation.
The announcements section shows you everything from insider trading reports to shareholding patterns of promoters and institutional investors. You learn who's buying or selling large stakes in companies, which gives you insight into smart money movements. When promoters increase their holdings, it often signals confidence in the company's future. When they reduce stakes, you might want to investigate why.
Cost savings from self-directed research
Research reports from brokerages and advisory firms can cost thousands of rupees annually. The NSE website provides much of this foundational data for free, letting you conduct your own analysis without subscription fees. You access historical price charts, trading volumes, and financial ratios that form the basis of most paid research.
Your ability to download data directly means you can build your own screening systems and tracking sheets. Instead of paying for someone else's stock picks, you evaluate companies using the same metrics that professional analysts use. This approach saves you money while building your financial knowledge and research skills.
The platform also hosts educational resources and market statistics that help you understand trading patterns and sector performance. You can study how different indices behave during various market cycles, which informs your asset allocation decisions. These insights become more valuable as you develop pattern recognition from repeated observation of market data.
How to navigate the NSE India official website
The homepage of the NSE India official website presents you with multiple sections that serve different purposes. You'll find the main navigation menu at the top, which breaks down into market data, products, participants, regulation, and resources. Your first visit might feel overwhelming, but the layout follows a logical structure once you understand where each type of information lives.
Finding live market data and indices
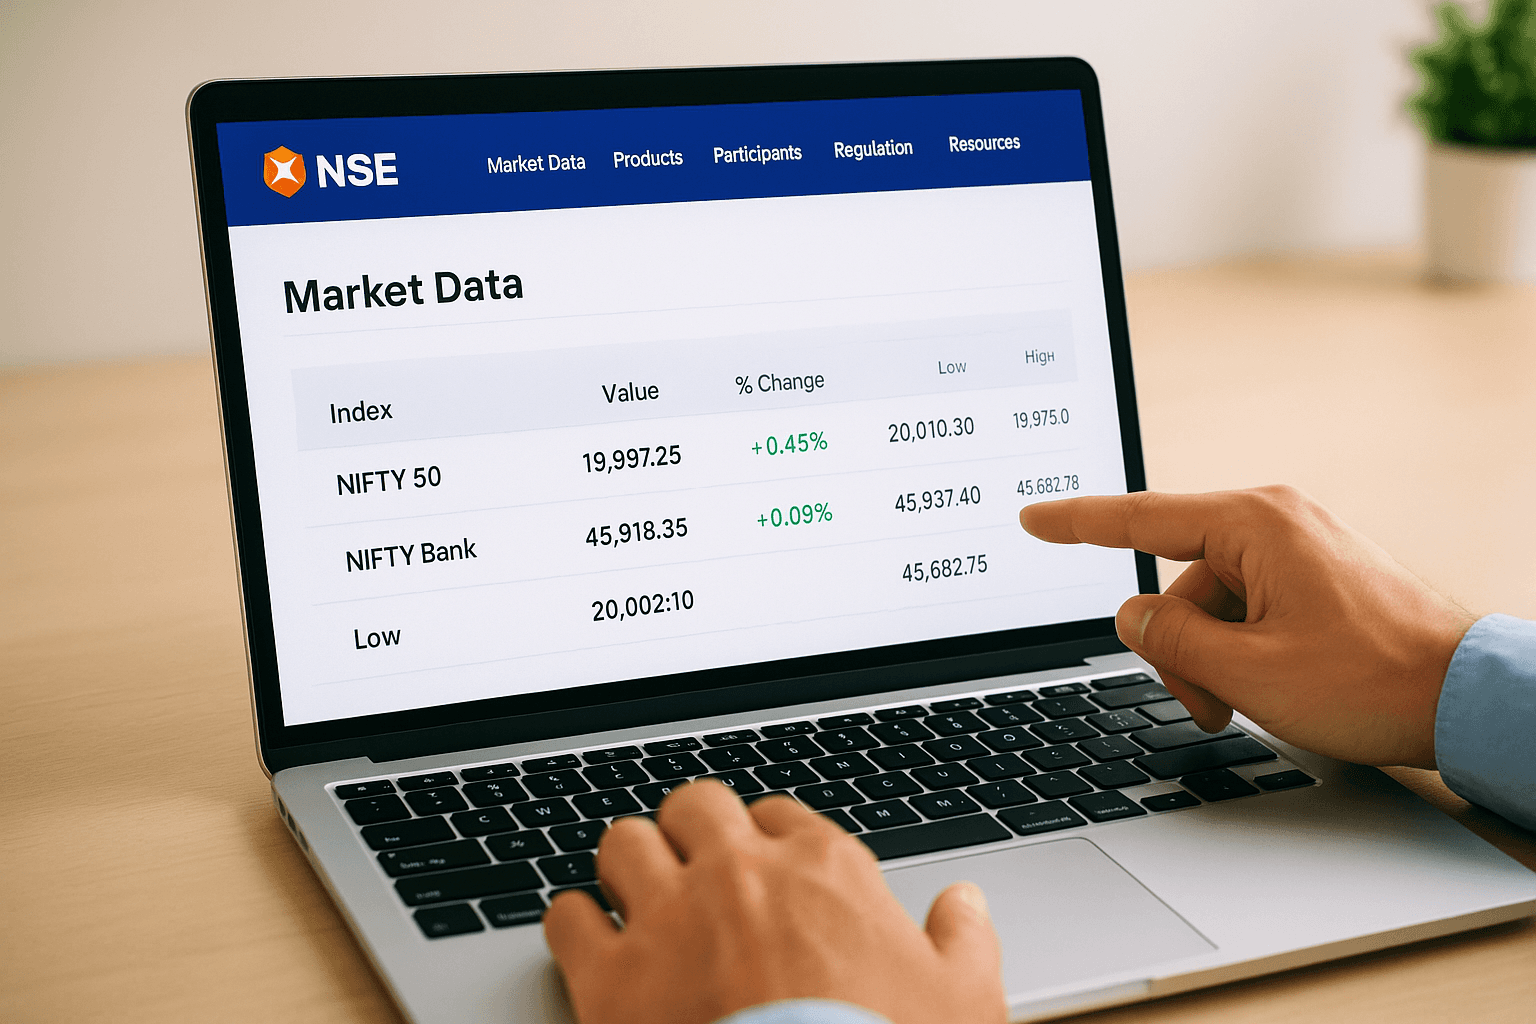
The "Market Data" section in the top navigation gives you instant access to live index values and stock prices. You click on "Live Market" to see real-time quotes for NIFTY 50, NIFTY Bank, and other major indices. The interface shows you the current value, percentage change, and intraday high and low for each index.
Individual stock quotes appear when you use the search bar at the top right of any page. You type in a company name or symbol, and the platform pulls up the current trading price along with the day's volume. The stock page displays bid and ask prices, market depth showing pending buy and sell orders, and historical price charts that you can adjust from intraday to yearly views.
The market depth feature reveals real-time supply and demand at different price levels, giving you insight into potential support and resistance zones.
Accessing company-specific information
You navigate to "Corporates" in the main menu to find detailed company profiles and financial documents. This section contains quarterly results, annual reports, and shareholding patterns for every listed entity. The search function lets you filter by company name or symbol to locate specific filings quickly.
Board meeting outcomes and dividend announcements appear under corporate actions, where you track record dates and payment schedules. You can download PDF versions of these filings directly to your device for offline reference. The shareholding pattern data shows you how promoters, institutional investors, and retail participants have changed their positions over recent quarters.
Understanding market statistics and reports
The "Resources" tab houses comprehensive market statistics and analytical reports that track trading patterns across sectors. You access historical trading data, monthly fact sheets, and annual statistical handbooks that document market evolution. These reports help you identify seasonal trends, sector rotation patterns, and liquidity changes that affect your investment strategies.
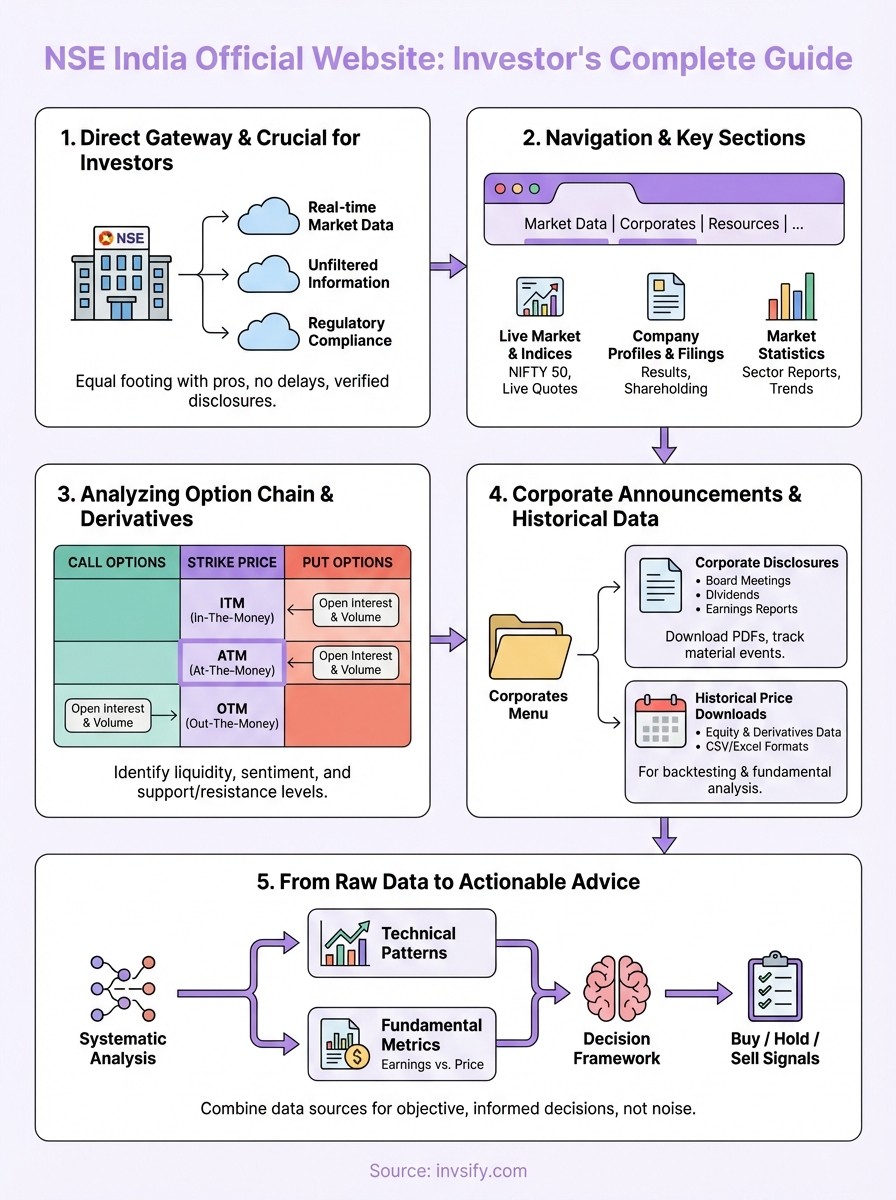
Analyzing the NSE option chain and derivatives
The derivatives section of the NSE India official website gives you detailed views of futures and options contracts that professionals use for hedging and speculation. You access this data through the "Market Data" menu by selecting "Derivatives" from the dropdown options. The platform displays option chains, futures prices, and open interest data that reveal market sentiment and potential price movements for underlying stocks and indices.
Understanding the option chain interface
You navigate to the option chain by selecting your desired underlying asset, which could be NIFTY, Bank NIFTY, or individual stock options. The interface displays call options on one side and put options on the other, organized by strike prices in the center column. Each row shows you the premium, change in price, volume, and open interest for that specific strike.
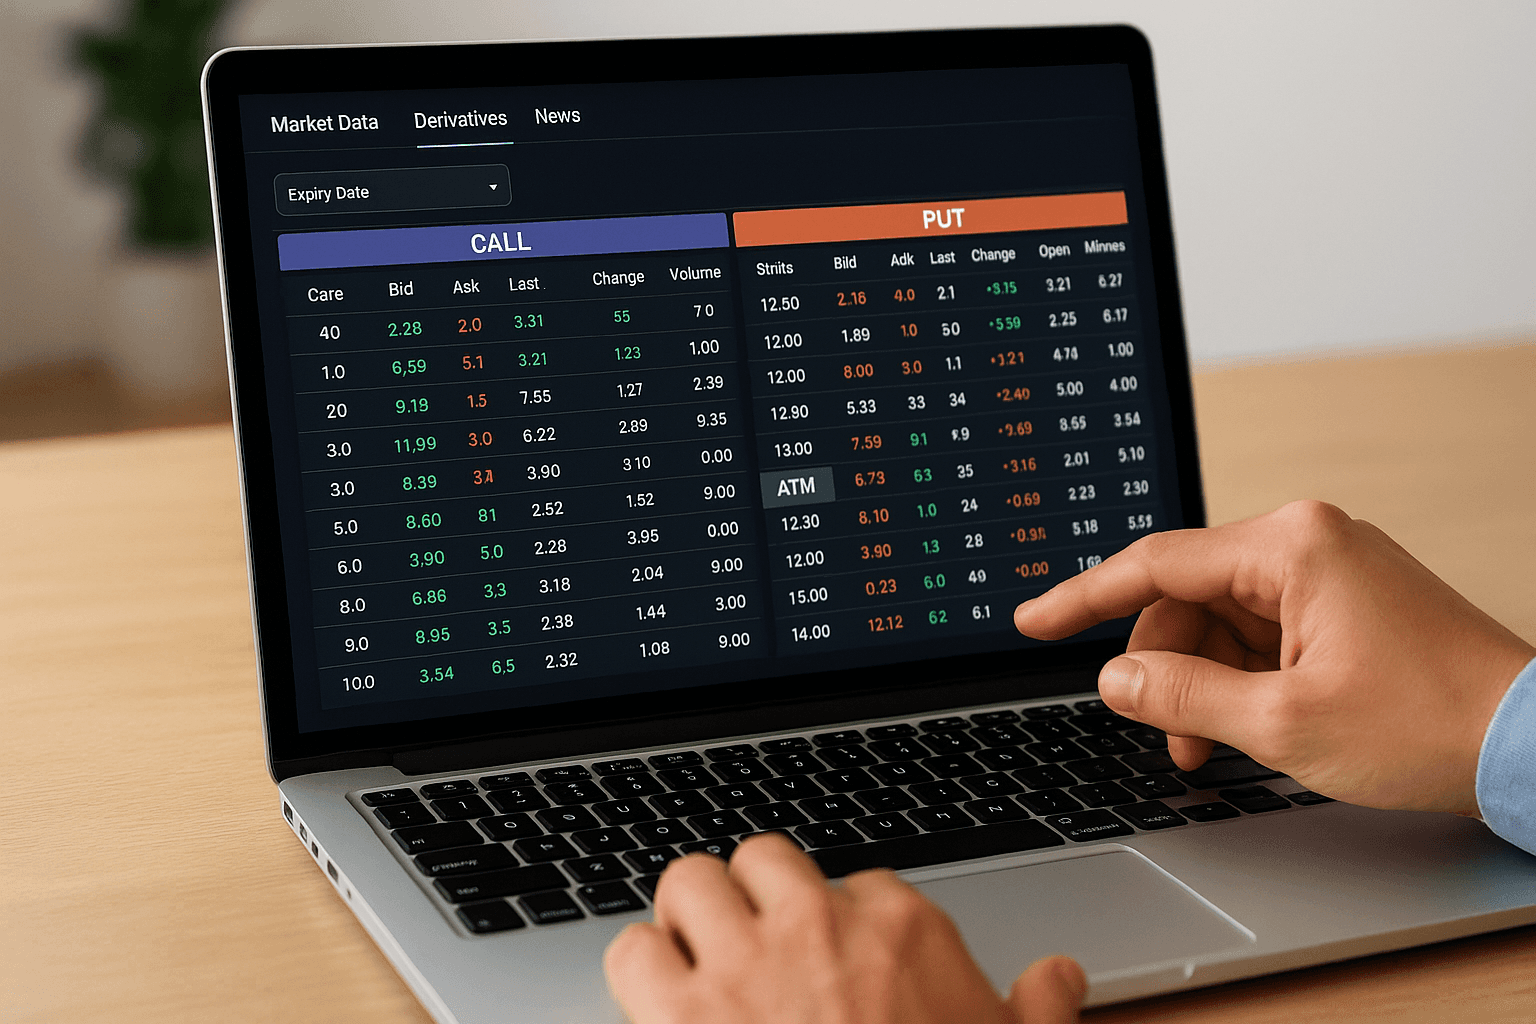
The at-the-money (ATM) strike typically shows the highest trading activity, which you identify by looking for the strike price closest to the current spot price of the underlying. You can switch between different expiry dates using the dropdown menu at the top, allowing you to compare near-term weekly expiries with monthly contracts. The color coding helps you quickly spot which options are in-the-money, at-the-money, or out-of-the-money based on the current market price.
Reading derivatives data effectively
Open interest tells you how many contracts remain active in the market, which indicates the depth of liquidity at each strike price. Rising open interest combined with increasing prices suggests new bullish positions, while rising open interest with falling prices points to bearish sentiment. You track these changes across multiple trading sessions to identify potential support and resistance levels where large institutional positions cluster.
High open interest at specific strikes often acts as a magnet, pulling the underlying price toward those levels as expiry approaches.
The put-call ratio (PCR) calculates by dividing total put open interest by total call open interest. Ratios above 1.2 generally indicate oversold conditions where puts outnumber calls, while readings below 0.7 suggest overbought markets with excessive call buying. You combine this ratio with price action and volume data to time your entries and exits more effectively than relying on spot prices alone.
Finding corporate announcements and historical data
The NSE India official website stores comprehensive corporate disclosures and historical market information that you need for fundamental analysis and backtesting strategies. You find quarterly earnings reports, board meeting outcomes, and management changes all archived in accessible formats. This historical repository lets you track how companies have performed over time and identify patterns in their corporate actions that might signal future opportunities or risks.
Locating corporate disclosures and announcements
You access corporate announcements through the "Corporates" menu, where you select "Corporate Announcements" from the dropdown. The search interface lets you filter by company name, date range, or announcement type such as board meetings, dividends, stock splits, or mergers. You can narrow results further by selecting specific categories like financial results or shareholding pattern changes.
Each announcement appears as a downloadable PDF or HTML document containing the exact information that companies submitted to the exchange. You review these filings to understand material events like acquisition plans, capital raising activities, or changes in key management personnel. The platform timestamps every disclosure, which helps you correlate corporate actions with stock price movements to identify market reactions and sentiment shifts.
Companies must file price-sensitive information immediately, giving you the same access to material events that institutional investors receive.
Downloading historical price data
The historical data section lives under "Market Data" where you select "Historical Data" from the available options. You choose between equity, derivatives, or indices data depending on your research needs. The interface requires you to specify the symbol, date range, and data type such as daily closing prices or full trading sessions with open, high, low, and close values.
Downloaded files come in CSV or Excel formats that you import directly into spreadsheet applications for analysis. You build custom charts, calculate technical indicators, or backtest trading strategies using this raw data. The platform maintains records going back several years, allowing you to study how stocks behaved during previous market cycles and economic conditions.
Moving from raw data to actionable investment advice
The NSE India official website provides you with raw numbers, but you need a systematic approach to convert this information into investment decisions. You face the challenge of transforming historical prices, corporate filings, and derivatives data into clear buy, hold, or sell signals that match your financial goals. Simply staring at numbers won't build your wealth; you need frameworks that connect data points to specific actions in your portfolio.
Converting price data into investment signals
You start by identifying price patterns and trend formations in the historical charts you download from the NSE platform. Support and resistance levels emerge when you study how stocks behave at specific price points across multiple time periods. You mark these zones on your charts and watch for volume confirmation when prices approach these critical areas, which helps you anticipate potential reversals or breakouts.
Technical indicators like moving averages, relative strength index, and volume trends give you quantifiable metrics for timing decisions. You calculate these indicators using the historical data sets available on the exchange website, creating custom spreadsheets that automatically update when you input new information. Your entry and exit points become less emotional and more systematic when you follow predetermined signals rather than reacting to daily market noise.
Combining fundamental metrics with market sentiment
Corporate announcements reveal earnings quality and management credibility that you cross-reference with stock price movements. You download quarterly results and compare actual performance against analyst expectations, noting how markets reward or punish companies that beat or miss estimates. This comparison helps you understand which financial metrics drive investor behavior in specific sectors.
The gap between reported earnings and stock price reaction often reveals market expectations that aren't visible in the numbers alone.
Shareholding patterns from the NSE database show you institutional confidence or concern about specific companies. You track whether mutual funds and foreign institutional investors increase positions during price corrections, which often signals buying opportunities. This institutional activity provides context that pure price data misses.
Building your decision-making framework
You create investment checklists that incorporate multiple data sources from the exchange platform. Your framework might require positive earnings growth, increasing institutional ownership, and technical confirmation before you commit capital. This systematic approach removes guesswork and keeps you focused on objective criteria rather than market hype or fear-driven decisions.
Smart usage of market data
The NSE India official website gives you direct access to market information that many investors pay thousands of rupees to access through premium platforms. You now know how to extract live prices, analyze option chains, review corporate filings, and download historical data without any subscription fees. This knowledge puts you on equal footing with professional traders who rely on the same data sources.
Your next step involves converting this raw information into portfolio decisions that match your financial goals. Data alone won't grow your wealth; you need systematic analysis combined with expert guidance to identify genuine opportunities and avoid costly mistakes. Invsify's AI-powered advisory transforms market data into personalized investment recommendations, giving you conflict-free advice backed by SEBI registration and advanced analytics that go beyond what raw numbers reveal.
