7 Portfolio Optimization Strategies for Indian Investors
Shlok Sobti

7 Portfolio Optimization Strategies for Indian Investors
You want better returns from your portfolio but you are not sure how to balance risk and reward. Most Indian investors either pay hefty commissions to distributors who push high fee products or piece together advice from online forums that might not fit their actual financial situation. You end up with a portfolio that looks random rather than optimized and your money does not work as hard as it could.
This guide walks you through seven portfolio optimization strategies that Indian investors can actually use. You will see how AI powered tools like Invsify simplify the process and learn classic methods like mean variance optimization and risk parity. Each strategy comes with practical steps including how to gather data for Indian assets calculate key metrics and decide which approach fits your risk profile and money goals. By the end you will know how to build a portfolio that maximizes returns for the risk you take instead of leaving your wealth to chance.
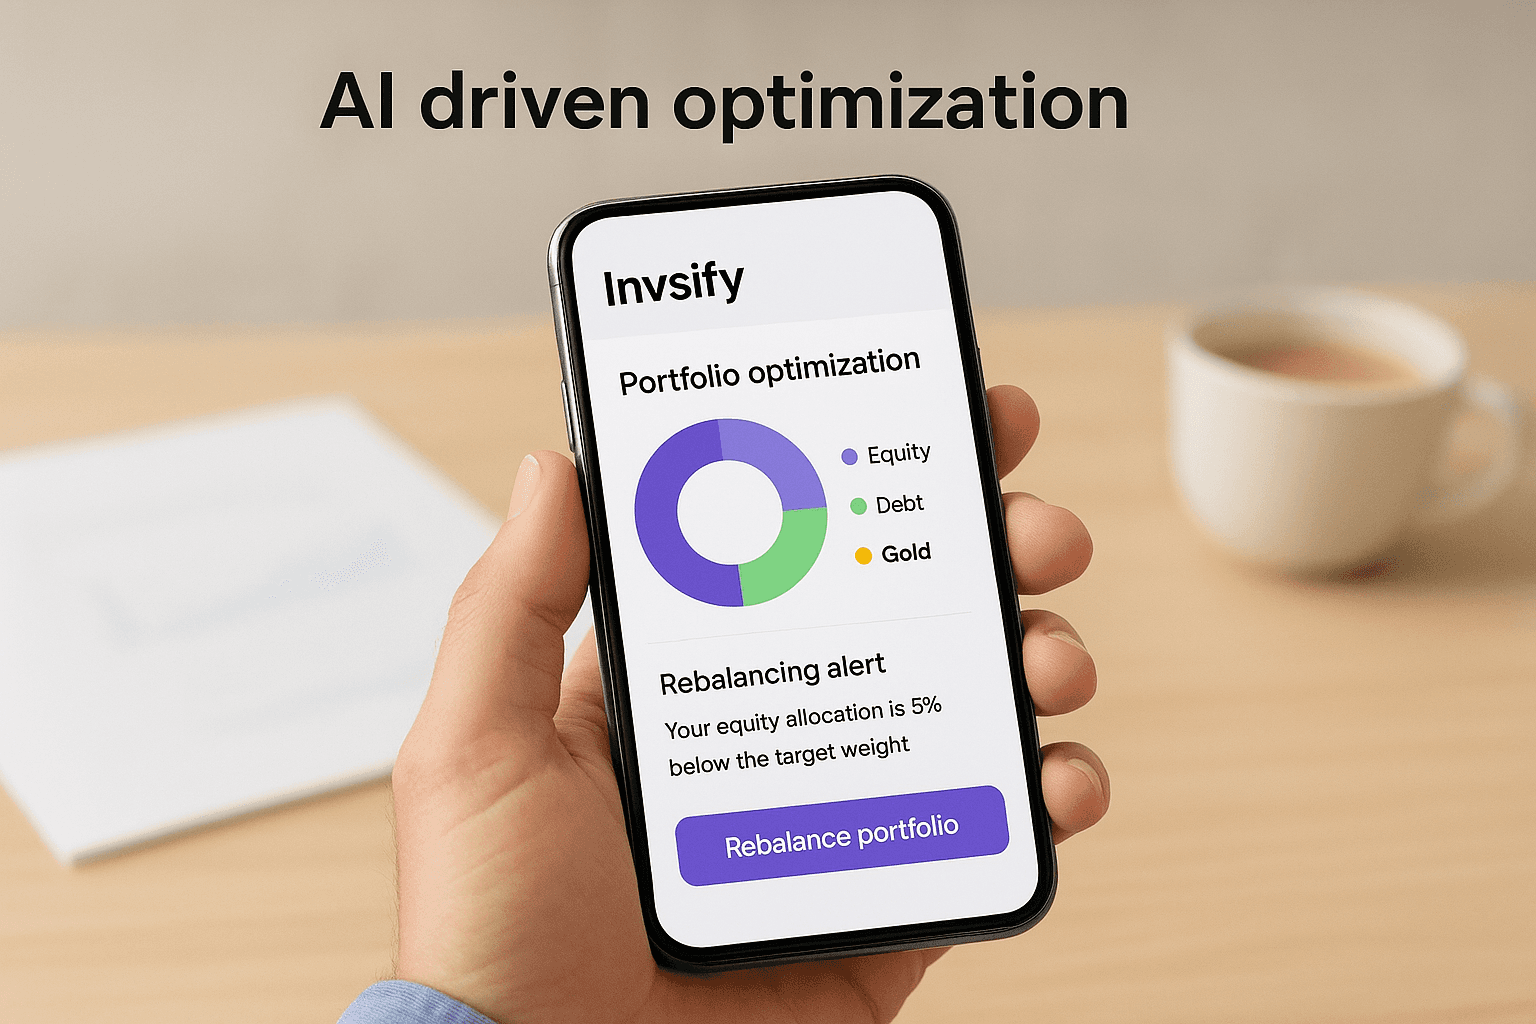
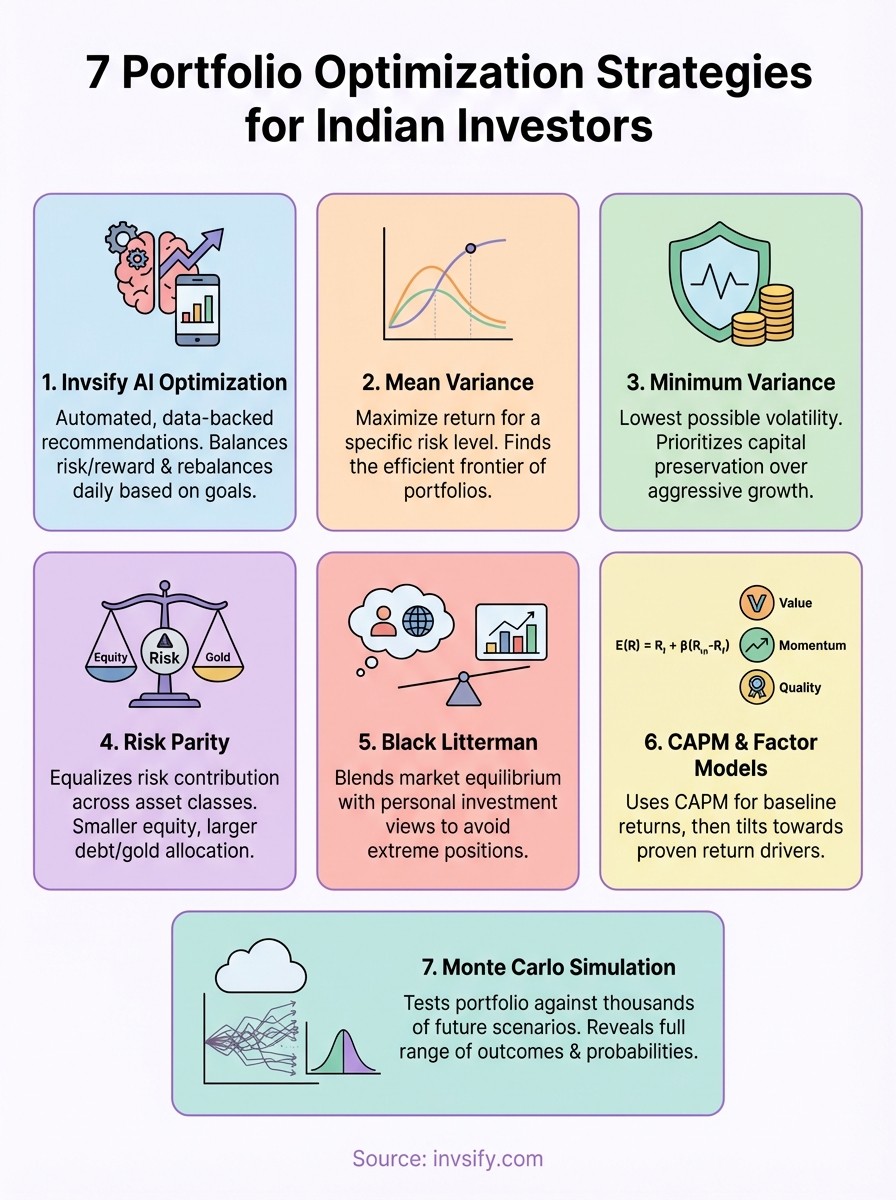
1. Use Invsify for AI driven optimization
Invsify brings together AI powered analysis and SEBI registered advisory to handle portfolio optimization for you. You skip the complex math of manual optimization and get data-backed recommendations that fit Indian market conditions. The platform watches your portfolio daily and suggests rebalancing moves when your allocation drifts from the target.
Translate your Indian money goals into numbers
You start by telling Invsify what you want from your money like retirement corpus child education or home purchase. The platform converts these goals into specific target amounts and time horizons. Your risk profile gets matched to appropriate asset allocations across equity debt and gold based on how much volatility you can handle.
Let Invsify build and rebalance your portfolio
The AI analyzes thousands of Indian mutual funds and direct stocks to build a portfolio that maximizes expected returns for your risk level. Portfolio rebalancing alerts arrive when markets move and your allocation shifts. You get clear instructions on which assets to buy or sell to restore optimal weightings without paying distributor commissions.
Use Invsify to manage risk taxes and costs
Tax optimization becomes automatic as the platform tracks your capital gains and suggests tax-loss harvesting opportunities. Hidden fee analysis shows exactly how much you save by avoiding traditional distributor products. Risk monitoring alerts you when portfolio volatility exceeds your comfort zone.
Decide if Invsify fits your investing style
Invsify works best if you want hands-off portfolio optimization strategies without learning complex financial models. Active traders who pick individual stocks daily might prefer more manual control. The platform suits anyone from beginners building their first portfolio to HNIs managing crores across multiple asset classes.
"AI-driven optimization removes emotion from rebalancing decisions and keeps your portfolio aligned with your actual risk capacity."
2. Apply mean variance optimization
Mean variance optimization stands as one of the most widely used portfolio optimization strategies in finance. You calculate the expected return and risk for different asset combinations to find the portfolio that gives you the highest return for a specific risk level. Harry Markowitz developed this approach in 1952 and it remains relevant for Indian investors who want to make data driven allocation decisions across equity debt and gold.
Understand the mean variance trade off
You face a fundamental trade off between returns and volatility when building any portfolio. Higher expected returns typically come with higher variance or risk measured as standard deviation of returns. Mean variance optimization helps you find portfolios that sit on the efficient frontier where you cannot improve returns without accepting more risk or reduce risk without sacrificing returns.
Gather return and risk data for Indian assets
You need historical returns for each asset you want to include in your portfolio like large cap funds mid cap funds debt funds and gold ETFs. Calculate monthly or yearly returns going back at least five years to get meaningful statistics. Then compute the covariance matrix that shows how each pair of assets moves together which drives diversification benefits.
Build the efficient frontier step by step
You start by defining minimum and maximum weights for each asset class based on your constraints. Run optimization calculations to find portfolio combinations that minimize variance for every target return level from conservative to aggressive. Plot these optimal portfolios on a graph with risk on the x axis and return on the y axis to see your efficient frontier.

"The efficient frontier shows you every portfolio mix that delivers maximum return for a given risk level, eliminating guesswork from asset allocation."
Judge if this method suits your risk profile
Mean variance optimization works well if you have stable return expectations and reliable covariance estimates for Indian assets. Short term investors with horizons under three years might find the method less useful because historical correlations can shift quickly during market stress. This approach assumes returns follow a normal distribution which may not hold during extreme market events.
3. Build a minimum variance portfolio
Minimum variance portfolio optimization strategies focus on reducing volatility rather than maximizing returns. You pick assets and weights that produce the lowest possible portfolio variance while staying diversified across different Indian asset classes. This approach suits conservative investors who prioritize capital preservation over aggressive growth and want smoother portfolio performance through market cycles.
Define a low risk portfolio objective
You set a primary goal of minimizing portfolio fluctuations measured by standard deviation of returns. Your target becomes finding the asset mix that delivers the smallest swings in portfolio value regardless of whether equity markets rally or crash. Risk averse investors near retirement or building emergency funds benefit most from this objective.
Pick Indian assets that diversify each other
You select combinations where different assets move in opposite directions during market stress. Pair equity mutual funds with debt funds government bonds and gold ETFs to create negative or low correlations. International equity exposure through feeder funds adds another diversification layer since foreign markets do not always move with Indian stocks.
Calculate and minimize portfolio variance
You compute the covariance matrix showing how each asset pair correlates and then solve for weights that minimize total portfolio variance. Optimization software or spreadsheet solvers handle the math by testing thousands of weight combinations. Your solution might allocate heavily to debt and gold with smaller equity positions compared to traditional balanced funds.
Blend minimum variance with growth goals
Minimum variance portfolios often underperform during bull markets because they hold less equity exposure. You can add a return constraint requiring at least a minimum expected return like inflation plus three percent to avoid overly conservative allocations. Balance your need for stability against long term wealth building requirements based on your financial timeline.
"Minimum variance optimization sacrifices potential upside to protect your portfolio from sharp drawdowns during market corrections."
4. Use risk parity across asset classes
Risk parity takes a different approach to portfolio optimization strategies by equalizing risk contribution rather than dollar allocation. You divide portfolio risk equally across asset classes so that equity debt and gold each contribute the same amount to total volatility. Traditional balanced funds put sixty percent in stocks which means equity drives ninety percent of portfolio risk while debt barely moves the needle.

See how risk parity spreads risk evenly
Risk parity calculates how much each asset class contributes to total portfolio variance and adjusts weights until contributions match. You end up with smaller equity positions and larger debt allocations because bonds are less volatile than stocks. Each asset pulls equal weight in determining your overall portfolio ups and downs instead of letting stocks dominate risk.
Choose equity debt gold and other Indian assets
You select asset classes that respond differently to economic conditions like inflation growth and interest rate changes. Equity mutual funds capture growth while government bonds protect against recession and gold hedges inflation. Adding international equity or commodities through mutual funds gives you more diversification levers to balance risk across your portfolio.
Estimate volatility and correlations correctly
Risk parity relies on accurate estimates of how volatile each asset is and how they move together. You calculate rolling standard deviations using at least three years of monthly returns for Indian equity debt and gold. Correlations shift during market stress when assets that normally diversify start moving together and ruin your risk balance.
Watch risks like leverage and crowded trades
Risk parity portfolios often use leverage on low volatility assets like bonds to match equity risk levels which magnifies losses during bond selloffs. Many institutional investors run similar risk parity strategies creating crowded trades that unwind violently when everyone exits at once. You need to monitor whether your portfolio can handle interest rate spikes without forced liquidations.
"Risk parity keeps any single asset class from hijacking your entire portfolio performance during market turbulence."
5. Optimize with the Black Litterman model
Black Litterman fixes major problems that plague mean variance and other portfolio optimization strategies by blending market equilibrium with your specific investment views. Traditional optimization produces extreme concentrated positions when you feed in historical returns and the results change drastically with small input tweaks. Black Litterman starts from stable market implied returns and lets you add personal opinions about specific Indian sectors or asset classes to create more realistic portfolios.
Fix classic optimization flaws with this model
Classic mean variance optimization often tells you to put ninety percent in one asset and zero in others based on tiny differences in historical returns. Black Litterman solves this by using market capitalization weights as the neutral starting point which reflects the collective wisdom of all investors. You get diversified portfolios that make intuitive sense instead of corner solutions that require constant rebalancing.

Start from market implied Indian asset returns
The model calculates equilibrium returns that justify current market cap weightings across Indian equity debt and gold. You assume markets are efficient so the existing allocation of wealth across asset classes reveals what returns investors expect. These equilibrium returns become your baseline before incorporating any personal forecasts about specific segments.
"Black Litterman anchors your portfolio in market reality while letting you tilt toward opportunities you understand better than average investors."
Add your own views about sectors and styles
You express confidence weighted opinions like expecting IT stocks to outperform by three percent or small caps beating large caps by five percent over the next year. The model blends your subjective views with market equilibrium using Bayesian statistics to produce final expected returns. Weak conviction views barely shift your portfolio while strong views create larger tilts.
Implement this method with tools and code
Python libraries like PyPortfolioOpt provide ready made Black Litterman functions that handle the matrix calculations for you. You input market caps your expected return views and confidence levels then the code outputs optimal weights.
6. Use CAPM and factor based models
CAPM and factor based portfolio optimization strategies combine academic theory with practical investing to predict returns more accurately than historical averages alone. You start with the Capital Asset Pricing Model to link expected returns to systematic risk then layer on additional factors that research shows drive outperformance. Factor investing has gained traction among Indian investors who want exposure to proven return drivers like value and momentum without picking individual stocks.
Use CAPM to anchor expected returns
You calculate expected returns for Indian equity funds by multiplying their beta coefficient against the market by the expected market risk premium. CAPM assumes the only risk that matters is how much an asset moves with the overall market measured by beta. Add the risk free rate from government bonds to this beta times premium calculation to get your baseline expected return for each equity position.
Add factors like value quality and momentum
Research shows that stocks with certain characteristics outperform the market over long periods beyond what beta explains. You tilt your portfolio toward value stocks trading below book value quality companies with strong balance sheets and momentum winners showing persistent price trends. Factor mutual funds and smart beta ETFs available in India let you access these tilts without building custom stock portfolios.
Build a diversified factor tilted portfolio
You allocate across multiple factors rather than betting everything on one because factor performance cycles through different market conditions. Value works during recoveries while momentum shines in trending markets and quality protects during downturns. Spread your factor exposure across four to six different tilts to smooth returns and avoid concentrated bets.
Avoid overfitting and chasing backtested stars
Factor strategies often show impressive historical returns that disappear when you invest real money because the backtests used perfect hindsight. You need to distinguish between genuine risk premiums that persist and data mining artifacts that vanish out of sample. Stick with factors backed by decades of academic research across multiple markets rather than newly discovered patterns optimized on Indian data alone.
"Factor investing captures systematic return drivers that reward you for taking specific risks markets price inefficiently over time."
7. Run Monte Carlo based portfolio simulations
Monte Carlo simulation tests your portfolio against thousands of possible future scenarios instead of relying on single point estimates for returns and risk. You generate random return sequences that follow the statistical properties of your asset classes then track how your portfolio performs across these simulated paths. This portfolio optimization strategy reveals the full range of outcomes you might face including rare disasters that other methods ignore.
Model many future paths for your portfolio
You define probability distributions for each asset class return and volatility based on historical Indian market data. The simulation engine draws thousands of random monthly returns respecting the correlations between assets and compounds them over your investment horizon. Each simulation path shows a different possible future where markets rally crash or drift sideways giving you a distribution of terminal wealth rather than one expected value.
Set realistic assumptions for Indian investors
Your simulation parameters need to reflect actual Indian market conditions like equity returns averaging twelve percent with twenty percent volatility over long periods. Account for inflation eroding purchasing power by running returns in real terms and include transaction costs rebalancing friction and taxes. Overly optimistic assumptions produce misleading confidence about reaching your financial goals.
Read scenario results and stress test outcomes
Monte Carlo output shows you the probability of meeting specific wealth targets like retiring with two crores or funding education in ten years. You see worst case scenarios in the fifth percentile that help you prepare for severe market downturns. Stress test results reveal how portfolio survival rates change if equity returns drop two percent or volatility doubles during your investment period.
Turn simulation insights into portfolio changes
Simulations might show your current allocation gives you only sixty percent odds of reaching your goal prompting you to increase equity exposure or contribution amounts. You adjust asset weights based on scenarios that failed most often like adding more debt if your portfolio crashed during recession simulations. Test modified allocations through new simulations until you find a mix that balances acceptable risk with high goal achievement probability.
"Monte Carlo simulation exposes the full spectrum of possible futures your portfolio might experience beyond optimistic average return projections."
Final thoughts
Portfolio optimization strategies transform random asset collections into engineered wealth machines that work harder for your money. You now understand seven practical approaches from AI powered tools like Invsify to academic methods like Black Litterman and Monte Carlo simulation. Each strategy solves specific problems whether you prioritize low volatility through minimum variance portfolios or balanced risk exposure through risk parity across Indian asset classes.
Your next move depends on how much time and technical skill you want to invest in portfolio management. Manual optimization requires gathering data calculating covariance matrices and solving complex equations that most investors would rather avoid. Invsify handles these calculations automatically while you focus on your financial goals and lets the AI rebalance your portfolio based on changing market conditions. Start optimizing your portfolio with Invsify to see how AI driven recommendations beat guesswork and distributor pushed products.
