Portfolio Visualizer Efficient Frontier: Step-By-Step Guide
Shlok Sobti

Portfolio Visualizer Efficient Frontier: Step-By-Step Guide
Every investor wants the best possible return for the level of risk they're willing to take. That's exactly what the efficient frontier helps you figure out, the optimal mix of assets in your portfolio. And if you've been searching for how to use Portfolio Visualizer efficient frontier tools, you're already on the right track toward smarter asset allocation.
Portfolio Visualizer is one of the most popular free platforms for backtesting and optimizing portfolios. Its efficient frontier tool lets you plot risk-return tradeoffs across different asset combinations, helping you see where your current portfolio stands and how it could improve. But navigating the tool for the first time can feel overwhelming, especially if you're new to mean-variance optimization concepts.
That's where this guide comes in. We'll walk you through every step, from setting up your assets to interpreting the frontier curve and adjusting allocations. At Invsify, we use AI-powered portfolio analysis to help Indian investors optimize their wealth, and understanding tools like Portfolio Visualizer is a great foundation for making data-driven investment decisions. Let's get into it.
What the efficient frontier shows and when to use it
The efficient frontier is a concept from modern portfolio theory, first introduced by Harry Markowitz in 1952. It's a curved line on a risk-return graph that represents all portfolios giving you the highest possible return for a given level of risk. Any portfolio sitting below that curve is considered suboptimal, meaning you're either taking on too much risk for the return you're getting, or leaving returns on the table entirely.
The risk-return tradeoff explained
When you plot multiple asset combinations on a graph with expected return on the Y-axis and standard deviation (risk) on the X-axis, patterns emerge quickly. Portfolios that cluster in the lower-right region carry high risk with low reward. Portfolios along the frontier curve, however, are the most efficient ones available given your inputs. The portfolio visualizer efficient frontier tool automates this math-heavy process, plotting hundreds of combinations instantly so you can see where your current allocation lands relative to the optimal curve.
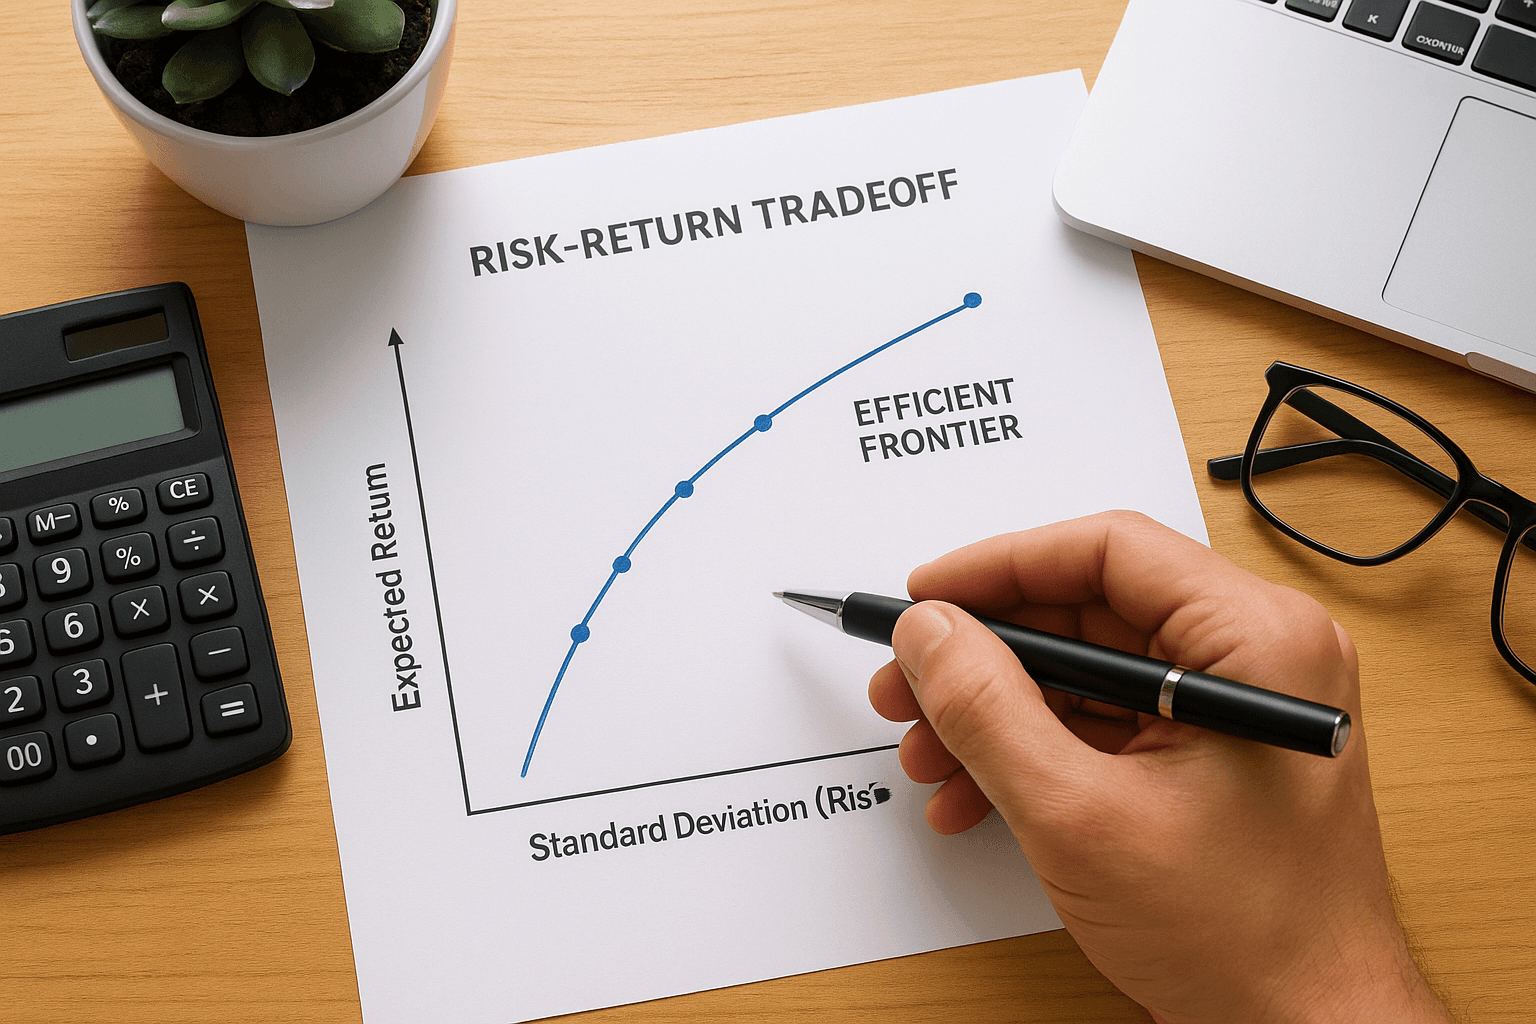
The goal isn't to find the portfolio with the highest return. It's to find the portfolio with the best return for the specific level of risk you're comfortable taking.
Each point on the frontier represents a different asset mix. The leftmost point is the minimum variance portfolio, which carries the lowest possible risk. As you move right along the curve, expected returns increase but so does volatility. Where you land on that curve depends entirely on your personal risk tolerance and investment timeline.
When to actually use the efficient frontier tool
This tool works best in specific situations. Use it when you're building a new portfolio from scratch and want to see how different asset classes interact before committing real money. It's also valuable when you suspect your current allocation is inefficient and want hard data to back up that feeling before rebalancing.
You should also run an efficient frontier analysis when you're adding a new asset class to your portfolio, such as international equities or gold. Seeing how the new asset shifts the frontier curve tells you exactly whether it improves your risk-adjusted return or just adds noise. Keep in mind, the frontier only reflects what your historical data and input assumptions suggest; it does not predict future performance.
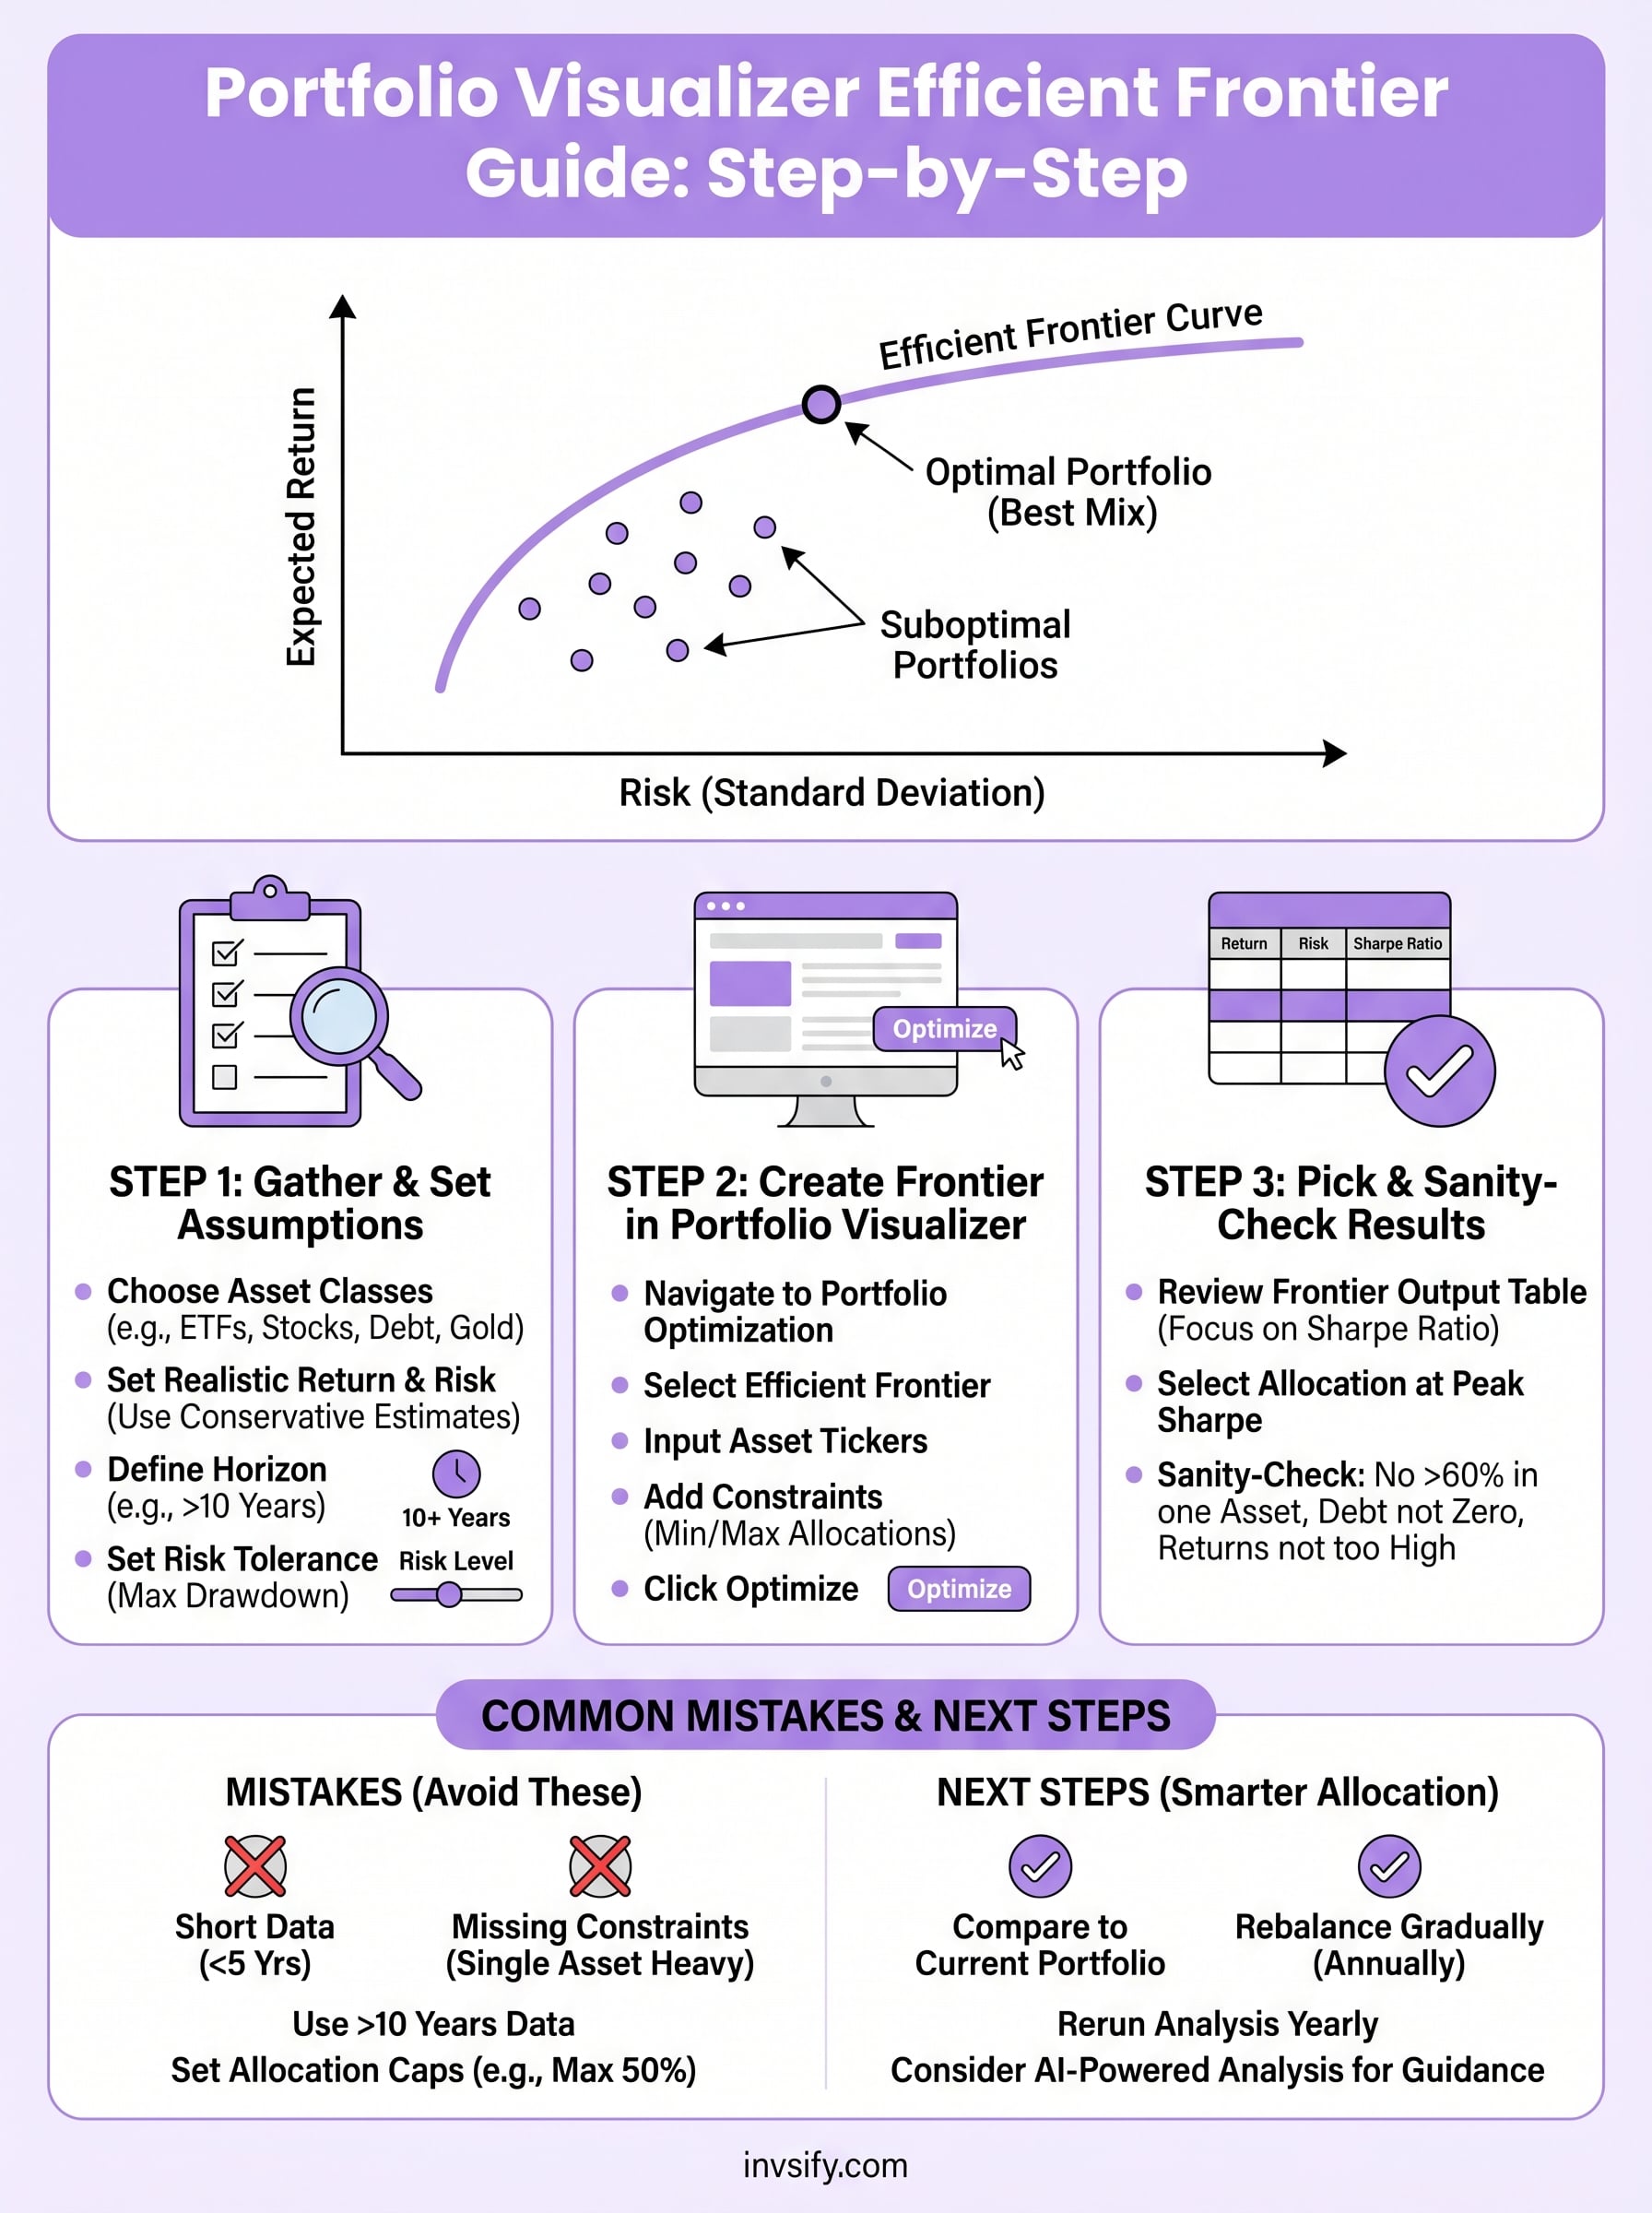
Step 1. Gather inputs and set realistic assumptions
Before you open Portfolio Visualizer, you need to decide which assets to include and what return and risk assumptions you'll use. Skipping this step is the most common reason people get results that look impressive on screen but fall apart in practice. Your inputs directly shape the frontier curve, so garbage in means garbage out.
Choose your asset classes
Start by listing the asset classes you're actually able to invest in, not just the ones that look good on paper. For Indian investors, this typically includes domestic equity (large-cap, mid-cap), debt funds, gold, and international equity funds. Portfolio Visualizer works with tickers, so use US-listed ETFs as proxies when your exact Indian fund isn't available. For example, use VWO as a proxy for emerging markets or GLD for gold.
Here's a simple input checklist to work through before you start:
At least 3 to 6 asset classes (fewer gives too little diversification; more than 10 adds confusion)
Historical ticker symbols you can enter directly into the tool
A defined investment horizon (5 years, 10 years, etc.)
Your maximum acceptable drawdown or volatility level
Set return and risk assumptions carefully
The portfolio visualizer efficient frontier tool lets you either use historical returns or input custom expected returns. Historical data is easier to start with, but treat it as a reference, not a forecast. Mean returns from past decades often overstate what you'll realistically earn going forward, especially in volatile markets.
Use conservative expected return estimates, especially for equity-heavy portfolios, to avoid building a plan that only works in ideal conditions.
Adjust your assumptions down by 1 to 2 percentage points from raw historical averages to account for costs, taxes, and market uncertainty.
Step 2. Create the efficient frontier in Portfolio Visualizer
With your assets and assumptions ready, you can now build the actual frontier. The portfolio visualizer efficient frontier tool is found under the "Backtest Portfolio" or "Asset Allocation" section, depending on the version you're using. Head to the free optimization module, which gives you direct access to mean-variance optimization without needing a paid account.
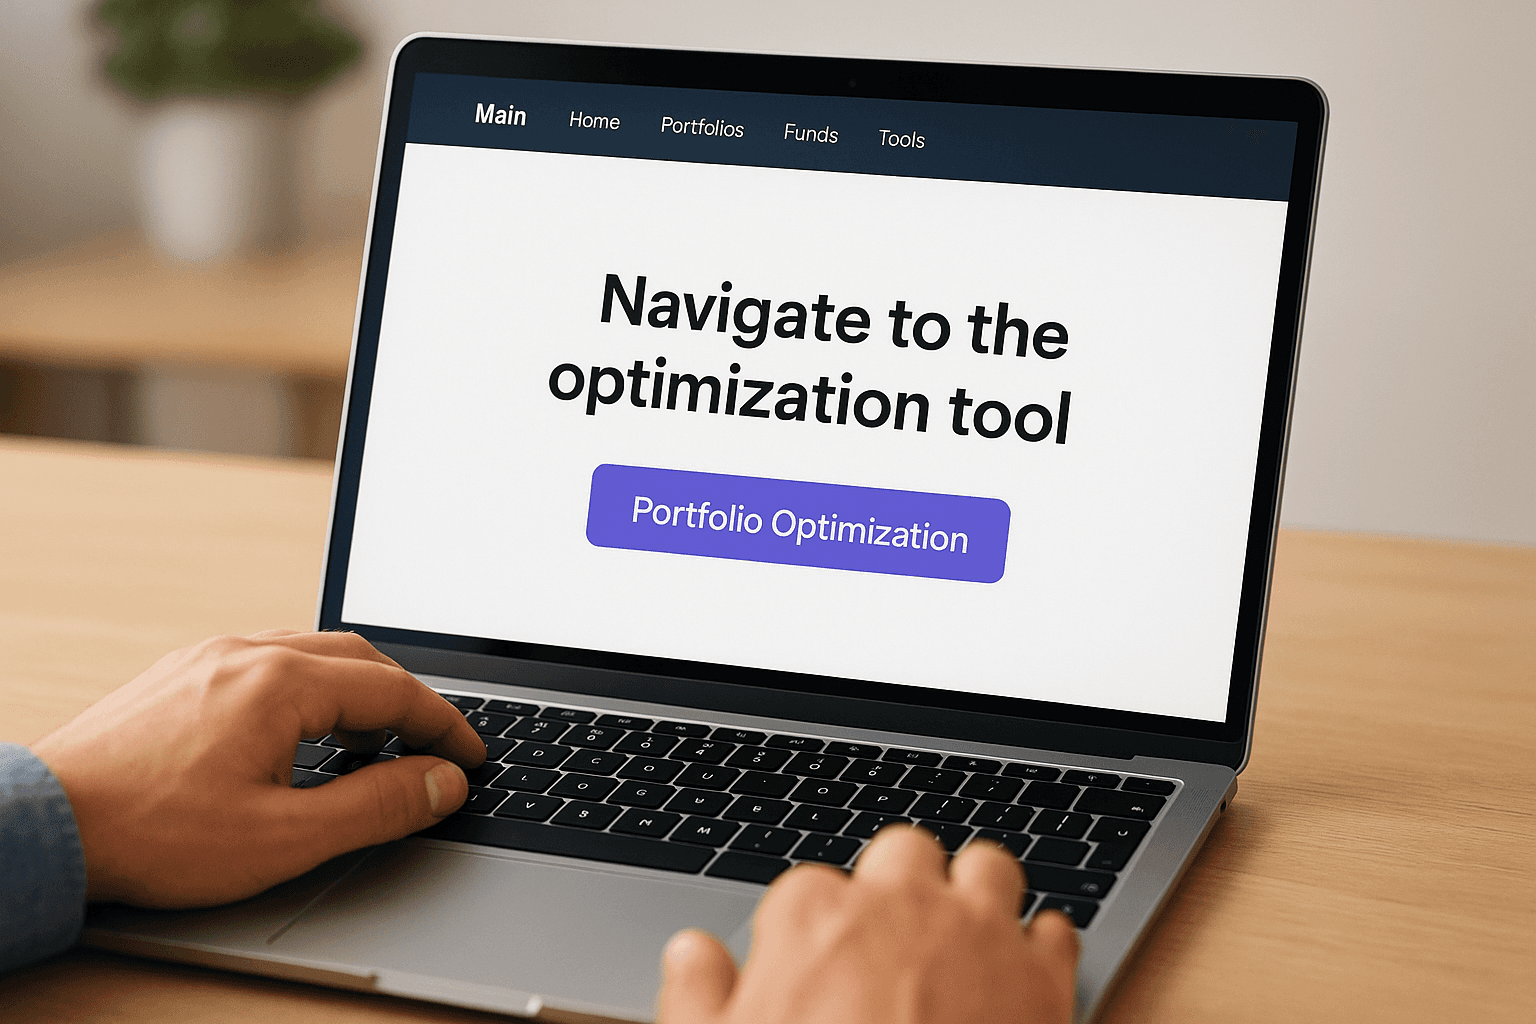
Navigate to the optimization tool
Open Portfolio Visualizer and click on "Portfolio Optimization" from the main menu. This section lets you input multiple assets and run an efficient frontier analysis with historical return data. Once inside, you'll follow a clear sequence of steps.
Here's the exact workflow to follow:
Select "Efficient Frontier" as your optimization type from the dropdown
Set the time period (use at least 10 years of data for more reliable output)
Add each asset ticker one by one in the asset fields
Enter any custom constraints such as minimum or maximum allocation per asset
Click "Optimize" to generate the frontier curve and the table of optimal portfolios
Configure the settings correctly
Pay close attention to the objective function setting before you run the analysis. You can optimize for maximum Sharpe ratio, minimum variance, or a custom return target. For most investors, maximum Sharpe ratio is the best starting point because it balances return and risk automatically rather than chasing the highest return in isolation.
Locking in a minimum allocation for each asset class (for example, at least 10% in debt) prevents the optimizer from producing unrealistic portfolios that no one would actually hold.
Set your rebalancing frequency to annual unless you have a specific reason to choose otherwise.
Step 3. Pick an optimal portfolio and sanity-check results
Once the portfolio visualizer efficient frontier generates its output, you'll see both a curve and a table of portfolio options ranked along that frontier. Your job now is to select the allocation that matches your actual risk tolerance, not just the one with the highest return on the chart.
Read the frontier output table
The table below the curve lists multiple portfolios from minimum variance to maximum return. Each row shows you a different asset mix with its expected return, standard deviation, and Sharpe ratio. Focus on the Sharpe ratio column first because it tells you how much return you're getting per unit of risk taken.
Look for the portfolio where the Sharpe ratio peaks and then starts to decline as you move right. That inflection point is typically your best risk-adjusted allocation. Write down the exact percentages for each asset class from that row before moving to the next step.
Run a basic sanity check
After selecting your optimal portfolio, check the results against common sense before acting on anything. A few red flags to watch for:
Any single asset receiving more than 60% allocation without a clear reason
Debt or defensive assets showing zero allocation in a long-term portfolio
Expected returns that seem unusually high compared to long-term market averages
If the model recommends something you would never realistically hold, the issue is almost always with your input assumptions, not the optimizer itself.
Run the optimization a second time with slightly adjusted return estimates to see how sensitive the output is to small changes. If the recommended portfolio shifts dramatically with minor tweaks, treat those results with caution.
Common mistakes and how to fix them
Most investors who use the portfolio visualizer efficient frontier tool hit the same problems repeatedly. They fall into two main areas: errors during setup and misinterpreting the results once the frontier generates. Catching these early saves you from building a portfolio that looks optimized on screen but performs poorly with real money.
Bad inputs and missing constraints
Selecting less than 5 years of data produces a frontier built on incomplete market conditions, so extend your time range to at least 10 years to capture both bull and bear cycles. Without constraints, the optimizer frequently pushes most of your allocation into one or two assets that happened to perform well in the selected period, which looks clean on paper but is practically unworkable.
Fix this by setting a minimum allocation of 5 to 10% per asset class and a maximum cap of 50% on any single holding before you run the optimization.
Locking in allocation bands in the constraint fields takes less than a minute and eliminates most of the extreme, concentrated portfolios the tool generates with default settings.
Misreading the output as a forecast
The frontier shows you historical risk-return relationships, not a prediction of what happens next year. Many investors pick an allocation from a single run and treat it as permanent. Rerun the analysis at least once a year or whenever you add a new asset class to check whether the optimal point has shifted with updated data.
Testing with slightly different return assumptions also reveals how robust your chosen allocation is. If the recommended mix shifts dramatically with minor input tweaks, the model is signaling that your output is fragile and needs a more conservative interpretation before you act on it.
Next steps
Running a portfolio visualizer efficient frontier analysis gives you a clear picture of where your current allocation stands and what a more efficient mix could look like. The framework is straightforward: gather solid inputs, set constraints that reflect reality, pick the allocation near the peak Sharpe ratio, and rerun the analysis annually to keep your portfolio aligned with updated data.
From here, take the optimal allocation percentages you identified and compare them directly against your current portfolio weights. If the gap is large, don't shift everything at once. Prioritize the biggest misalignments first and rebalance gradually to reduce tax and cost drag. For Indian investors specifically, factoring in expense ratios and tax efficiency when selecting the actual funds matters just as much as getting the allocation right.
If you want personalized, AI-driven guidance on optimizing your portfolio without the manual work, start your wealth optimization journey with Invsify today.
