How To Read A Mutual Fund Fact Sheet: Key Metrics Explained
Shlok Sobti

How To Read A Mutual Fund Fact Sheet: Key Metrics Explained
A mutual fund fact sheet is just two pages long, but it packs in enough jargon and numbers to make most investors skip it entirely. That's a problem. Knowing how to read a mutual fund fact sheet gives you a real edge, it's the quickest way to assess whether a fund actually fits your goals or if you're about to park your money somewhere that doesn't. Think of it as a fund's report card, available every month, and free for anyone to download from the AMC's website.
The fact sheet covers everything from portfolio composition and expense ratios to risk measures like standard deviation and Sharpe ratio. Once you understand what each section means, you stop relying on star ratings or someone else's opinion and start making decisions backed by actual data. That's exactly the kind of informed investing we build for at Invsify, our AI-powered advisory helps you cut through noise and focus on what the numbers really say.
This guide breaks down every major section of a mutual fund fact sheet, explains the key metrics in plain language, and shows you how to use them to evaluate a fund before you invest. Whether you're comparing two large-cap funds or reviewing a debt fund's credit quality, you'll walk away knowing exactly where to look and what to look for.
What a mutual fund fact sheet includes
A typical fact sheet published by an AMC in India is a standardized monthly document of one to two pages. When you learn how to read a mutual fund fact sheet, you realize it's organized into distinct sections, each answering a specific question about the fund. Understanding the layout first saves you time every time you open one.
A fact sheet is not a marketing brochure. It's a regulated disclosure, which means the data inside it follows standardized reporting norms set by SEBI and AMFI.
Fund-level information
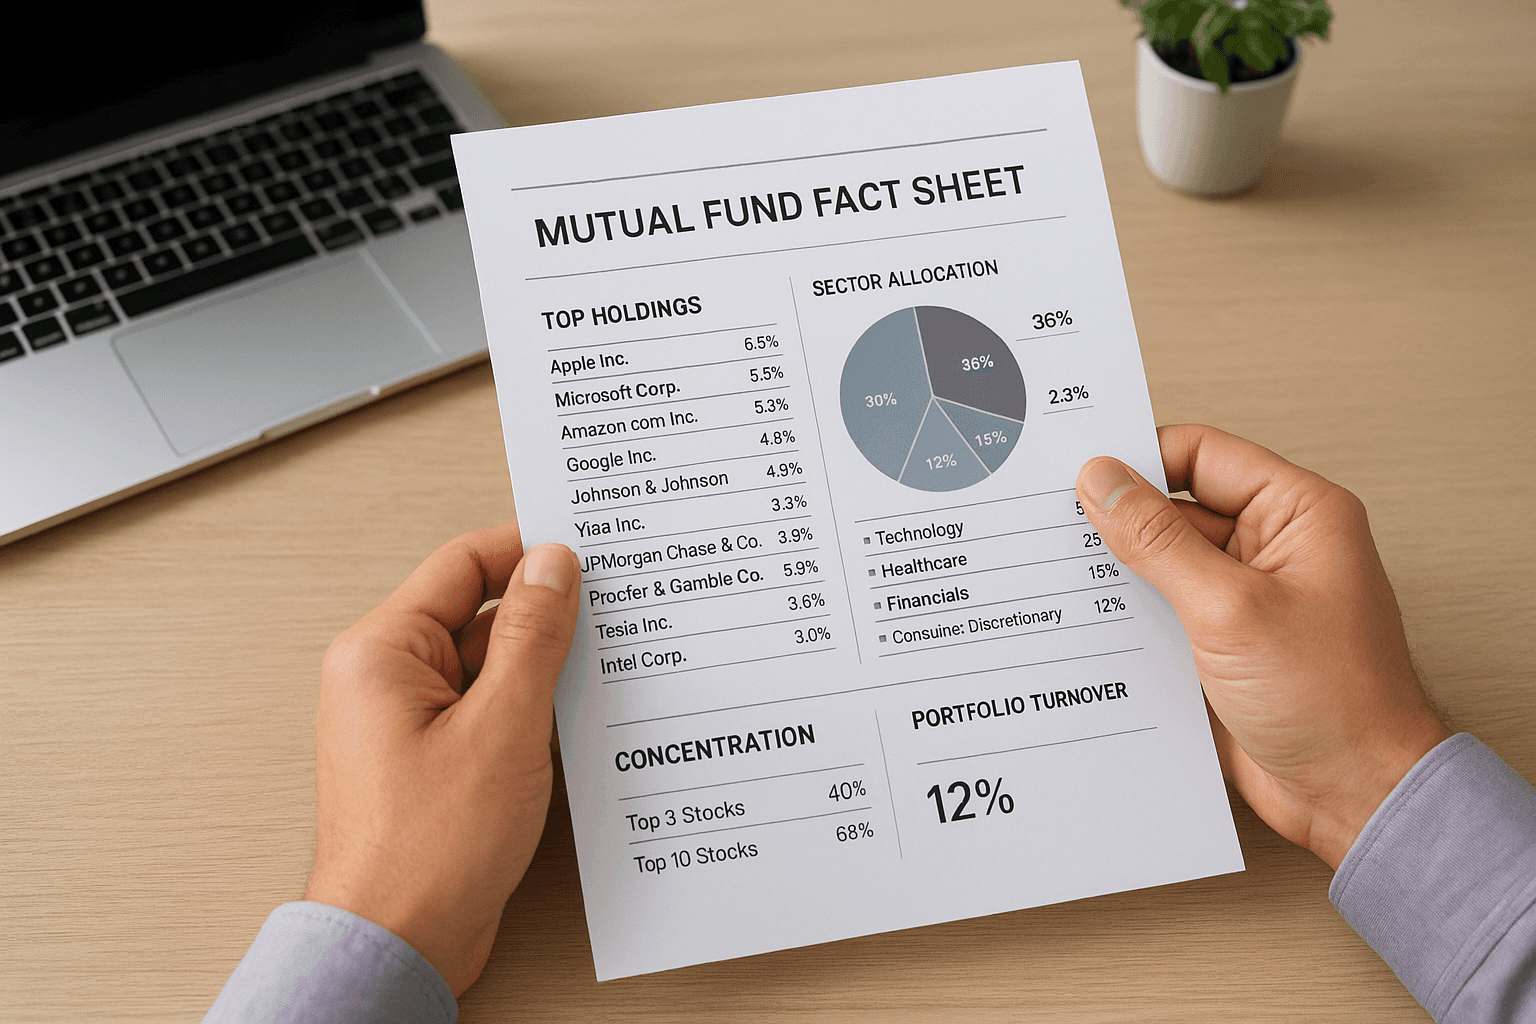
This section sits at the top of every fact sheet and gives you the basic identity of the fund. It includes the fund name, category (such as large-cap, flexi-cap, or liquid), the name of the fund manager, the fund's inception date, AUM (Assets Under Management), and the expense ratio. You also find the minimum investment amount and exit load details here.
Performance and portfolio data
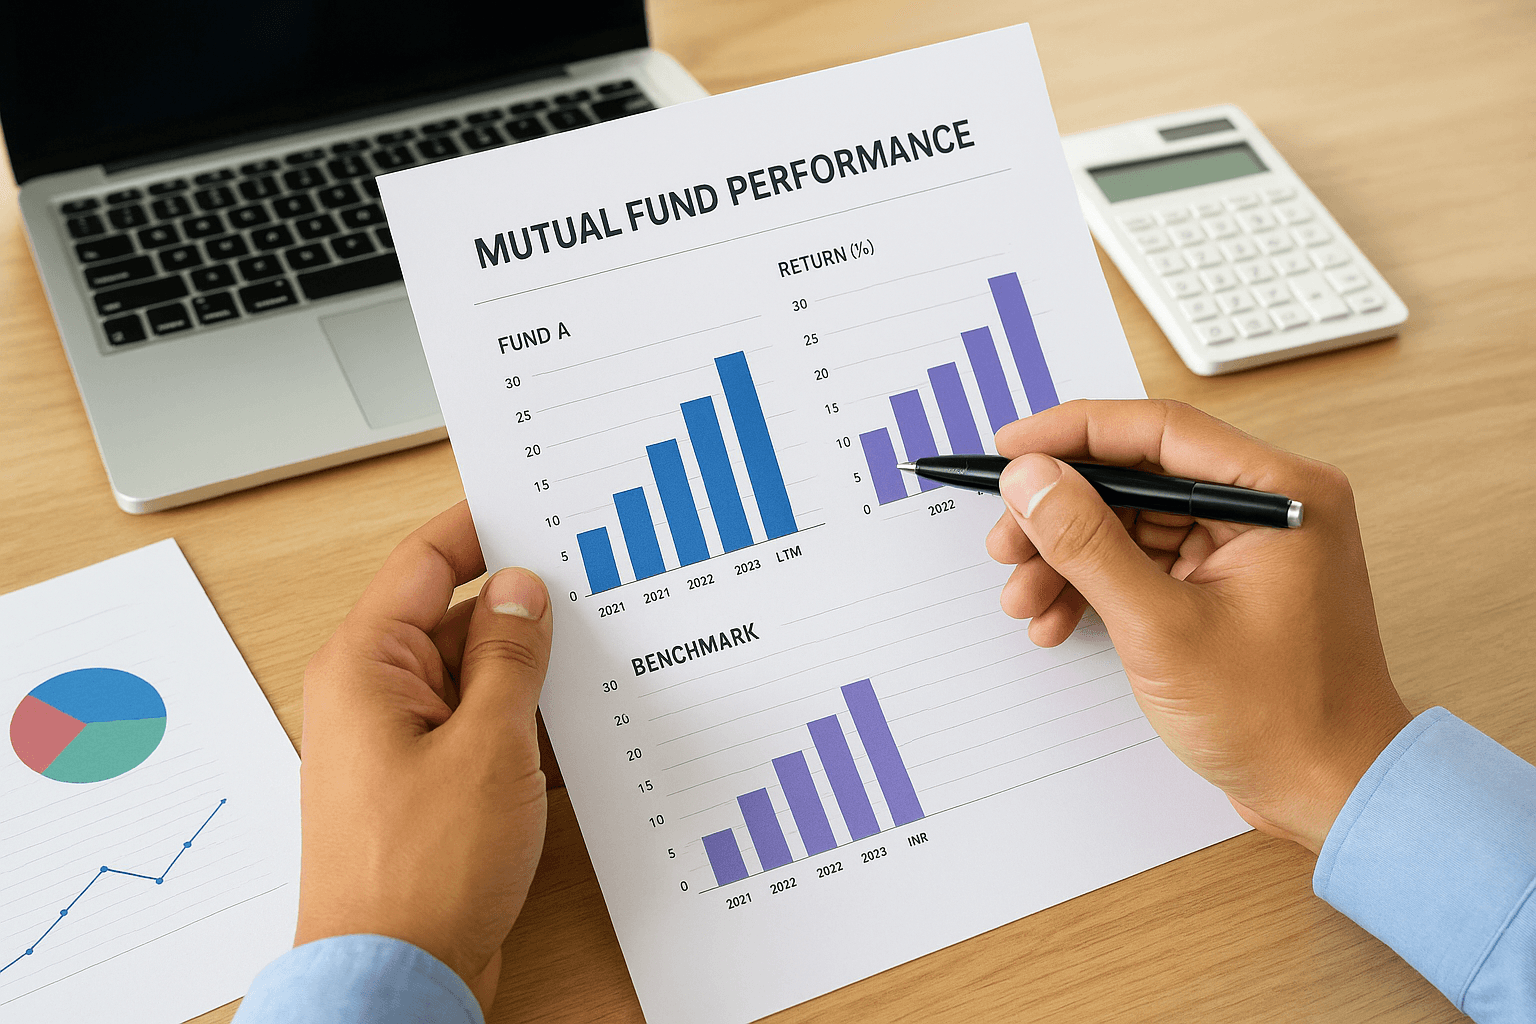
The bulk of the fact sheet covers how the fund has performed across different time periods, typically 1 year, 3 years, 5 years, and since inception, and compares those returns against a benchmark index. Below the performance table, you get the portfolio breakdown: the top 10 to 15 stock or bond holdings, their percentage allocation, the sector distribution, and credit quality ratings for debt funds.
Beyond returns, you also find key risk ratios like standard deviation, Sharpe ratio, beta, and portfolio turnover rate. Some AMCs include a brief fund manager commentary at the end, explaining recent portfolio changes and the rationale behind them. Reading all three layers together, fund basics, performance data, and risk metrics, gives you a complete picture before you put any money in.
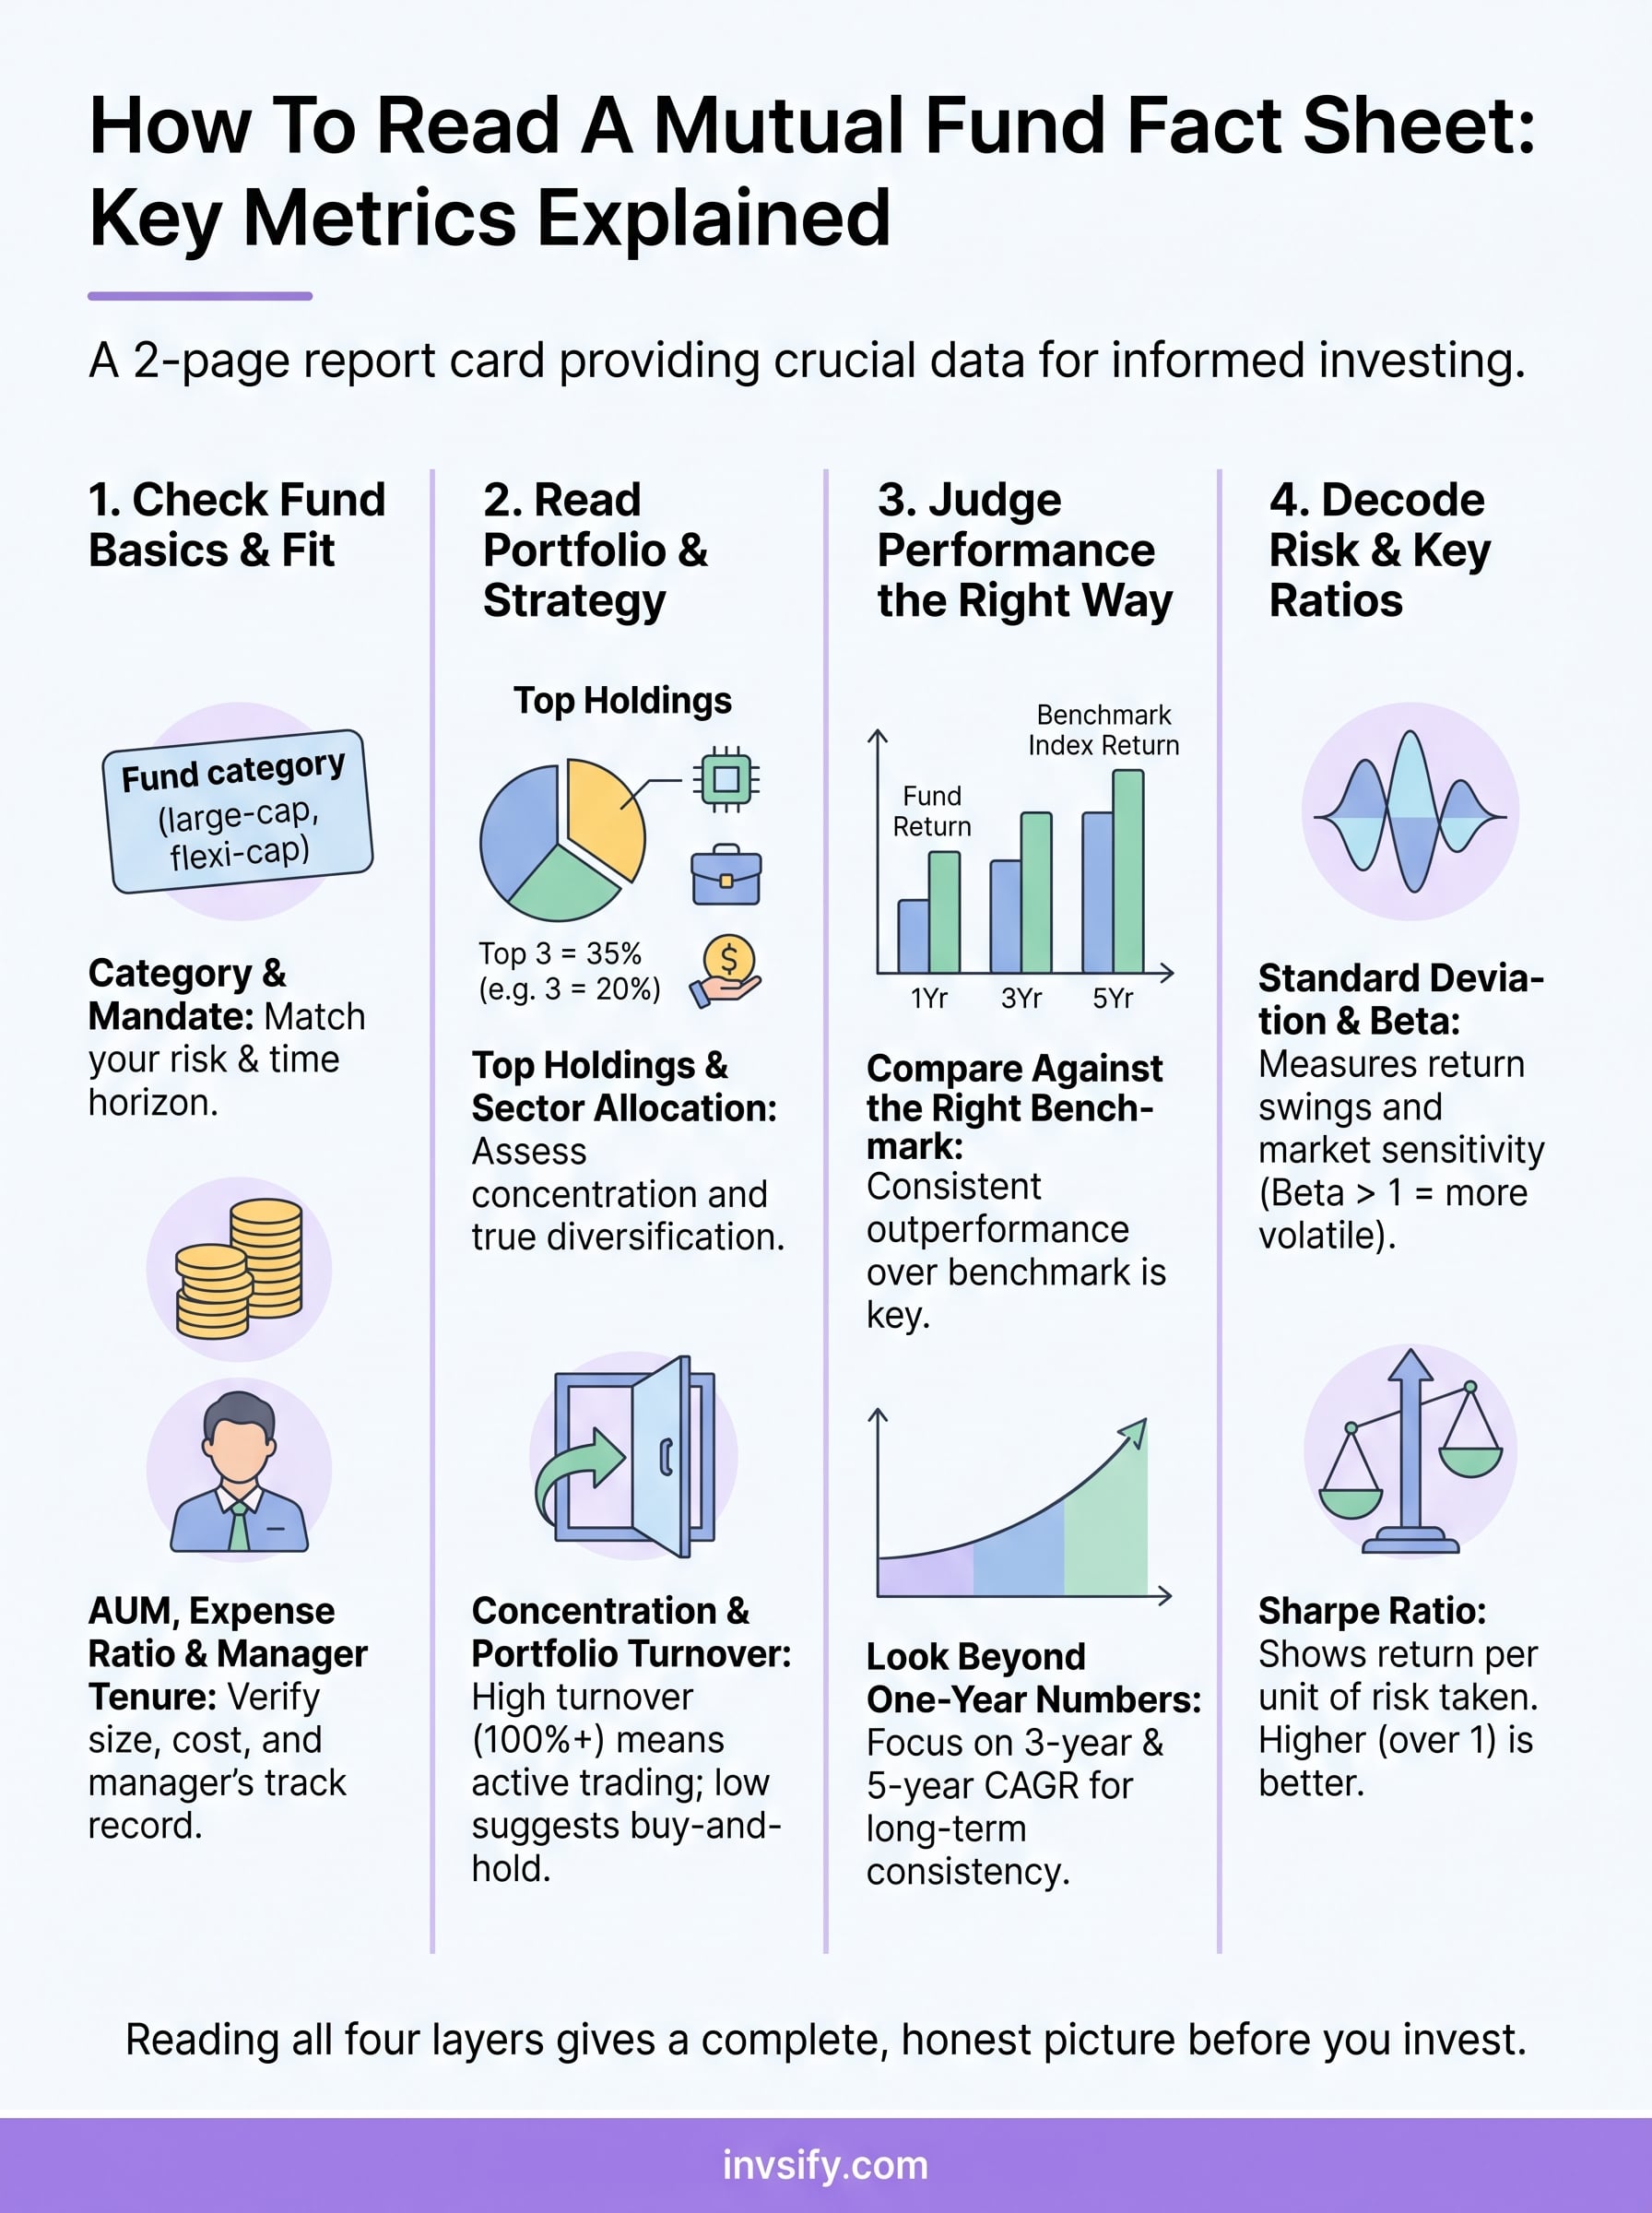
Step 1. Check fund basics and fit
Before you dig into returns or ratios, the first thing to do when learning how to read a mutual fund fact sheet is verify the fund's basic identity. This section tells you whether the fund belongs in your portfolio at all, saving you time before you go deeper into the numbers.
Fund category and mandate
The fund category tells you exactly what the fund manager is allowed to invest in. A large-cap fund must invest at least 80% in the top 100 companies by market cap per SEBI norms, while a flexi-cap fund can move freely across market caps. If you want aggressive growth, match your goal to the right mandate first, not the other way around.
Always match the fund category to your own risk tolerance and time horizon before looking at any performance data.
AUM, expense ratio, and fund manager tenure
AUM size matters more than most investors realize. A very large AUM in a small-cap fund limits the manager's ability to enter and exit positions without moving the market. Check the expense ratio next: even a 0.5% difference compounds significantly over 10 years. Verify the fund manager's tenure on the fund too, because a recent management change weakens the reliability of the historical track record.
Step 2. Read the portfolio and strategy
Once you confirm the fund basics fit your goals, the next step in understanding how to read a mutual fund fact sheet is looking at what the fund actually owns. The portfolio section shows you whether the fund manager's strategy matches what the category label promises.
Top holdings and sector allocation
The top 10 holdings list tells you where most of your money will sit. If the top three stocks together make up 35% or more of the portfolio, the fund is highly concentrated, meaning strong upside when those bets pay off, but a sharper fall when they don't. Check the sector allocation table alongside it: a fund claiming to be diversified but with 40% in financial services alone is not as balanced as it appears.
A mismatch between the stated strategy and the actual portfolio is a red flag worth acting on before you invest.
Concentration and portfolio turnover
Portfolio turnover rate measures how often the fund manager buys and sells holdings within a year. A high turnover, above 100%, means frequent trading, which drives up costs and signals an active, tactical approach. A low turnover suggests a buy-and-hold strategy, which typically suits long-term investors better.
Step 3. Judge performance the right way
Performance numbers are the section most investors jump to first, but raw returns without context mislead more than they guide. When you understand how to read a mutual fund fact sheet properly, a fund's return only makes sense when measured against the right benchmark and across the right time period.
Compare against the right benchmark
Every fact sheet lists returns alongside a benchmark index, such as the Nifty 50 or Nifty Midcap 150. A fund that returned 14% last year looks strong until you see the benchmark returned 18% over the same period. Consistent underperformance against the benchmark across multiple years is a clear sign the fund is not adding value.
Rolling returns over 3 to 5 years give you a far more reliable picture than point-to-point returns, which can change dramatically depending on the start and end dates you pick.
Look beyond one-year numbers
Short-term returns are heavily influenced by market timing and luck. Focus on 3-year and 5-year CAGR figures to judge whether the fund has delivered consistent results across different market cycles, not just during a favorable period.
Consistent alpha generation over rolling 5-year periods signals genuine fund manager skill. If you see strong 1-year returns but weak 3-year numbers, the recent performance likely reflects a favorable short-term cycle rather than a repeatable strategy worth betting on.
Step 4. Decode risk and key ratios
Returns tell you what happened. Risk ratios tell you how much danger the fund took on to get there. When you know how to read a mutual fund fact sheet, these numbers stop looking intimidating and start giving you real answers about whether a fund suits your risk appetite.
Standard deviation and beta
Standard deviation measures how much the fund's returns swing around its average. A higher number means more volatility, which is fine if you have a long horizon, but painful if you need the money in two years. Beta compares the fund's movement to its benchmark: a beta above 1 means the fund amplifies market moves, while a beta below 1 means it cushions them.
Read beta alongside standard deviation together, not separately, for a complete picture of a fund's actual risk behavior.
Sharpe ratio and what it signals
The Sharpe ratio answers a critical question: how much return did the fund earn for every unit of risk it took? A higher Sharpe ratio (above 1 is generally considered strong) means the fund delivers better risk-adjusted returns. Compare this ratio across funds in the same category to identify which manager is genuinely earning returns, not just taking on more risk to chase bigger numbers.
Your next step
You now have everything you need to understand how to read a mutual fund fact sheet without guessing or relying on someone else's summary. Each section of the fact sheet answers a specific question: does this fund fit your goals, does the manager stick to the stated strategy, do the returns hold up across market cycles, and does the risk taken justify the reward earned? Reading all four layers together gives you a complete, honest picture of any fund before you commit a single rupee.
Putting this into practice on your own portfolio, across multiple funds and categories, takes time and a sharp eye. That's where having the right tool helps. Invsify's AI-powered advisory analyzes your portfolio against exactly these metrics and surfaces the insights that matter to you, without the conflict of interest that comes with traditional distributors. Start building a smarter portfolio with Invsify and let data drive your next investment decision.
